

Is The Dallas Housing Market In Trouble? July 2023 Dallas Real Estate Update!
Whether you're a seasoned investor, a potential homebuyer, or just curious about the ever-changing landscape of the real estate market, you've come to the right place. Welcome to our channel, where facts reign supreme and insights are the name of the game. We're here to provide you with the nitty-gritty details you need to make informed decisions about the dynamic world of real estate.
If you're new here, let me give you a quick rundown of what to expect. In this video, we're diving headfirst into the numbers, dissecting the top 10 biggest winner and loser cities for the month of July 2023 in the bustling DFW metro area. But before we jump into the data, let's set the stage and provide a little context.
You see, we believe in transparency, which is why we've set certain criteria for the cities we analyze. To ensure accuracy and reliability, we focus on cities that have seen a minimum of 30 close transactions in a given month. This helps us sift through the noise and provide you with a clearer picture of the market's movements. Oh, and when we talk about prices, we're all about that median sales price, not the average. Why? Because medians tend to smooth out any wild fluctuations and give us a more balanced view.
Now, you might be wondering, "Why haven't they mentioned my dream city yet?" Hold tight! Our analysis is a snapshot in time, capturing the numbers as they were on the first day of the month. As diligent agents update their listings, these figures can sway a bit. So, if you're waiting for your city to make an appearance, stick around – you might just find the insights you're seeking.
But that's not all – we're not just about winners and losers. After we've unraveled the tale of the cities, we're delving into the heart of the DFW metro area. We'll uncover the performance of the local Multiple Listing Service (MLS), giving you a panoramic view of how things are shaping up. And as a little bonus, we'll sprinkle in our predictions for the coming months, giving you a glimpse of what the future might hold.
So, buckle up, because we're about to journey through the top 10 biggest winners and losers of July 2023. From the upscale allure of Colleyville to the promising rise of Argyle, and from the intriguing decline of Dallas to the unexpected twists of The Colony, our analysis leaves no stone unturned.
Whether you're itching to make a move, curious about market trends, or just fascinated by the ebb and flow of real estate, you're in for a treat. Stick around as we break down the numbers, unveil the stories, and equip you with the insights you need to make the right choices. After all, knowledge is power, and we're here to empower you on your real estate journey in the vibrant DFW metro area.
Biggest Winners July 2023
Winner #10 - Colleyville Texas
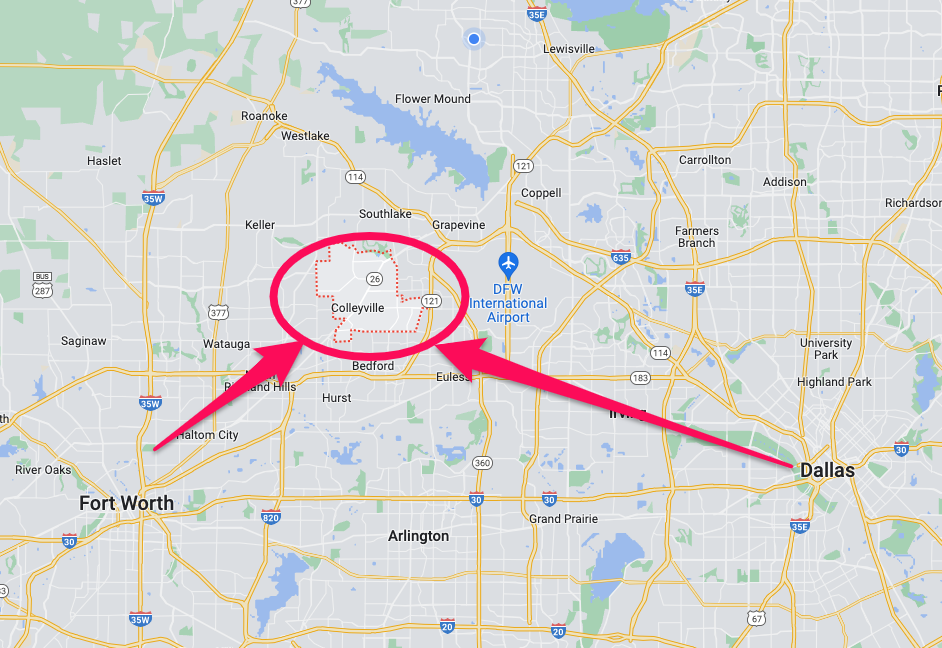
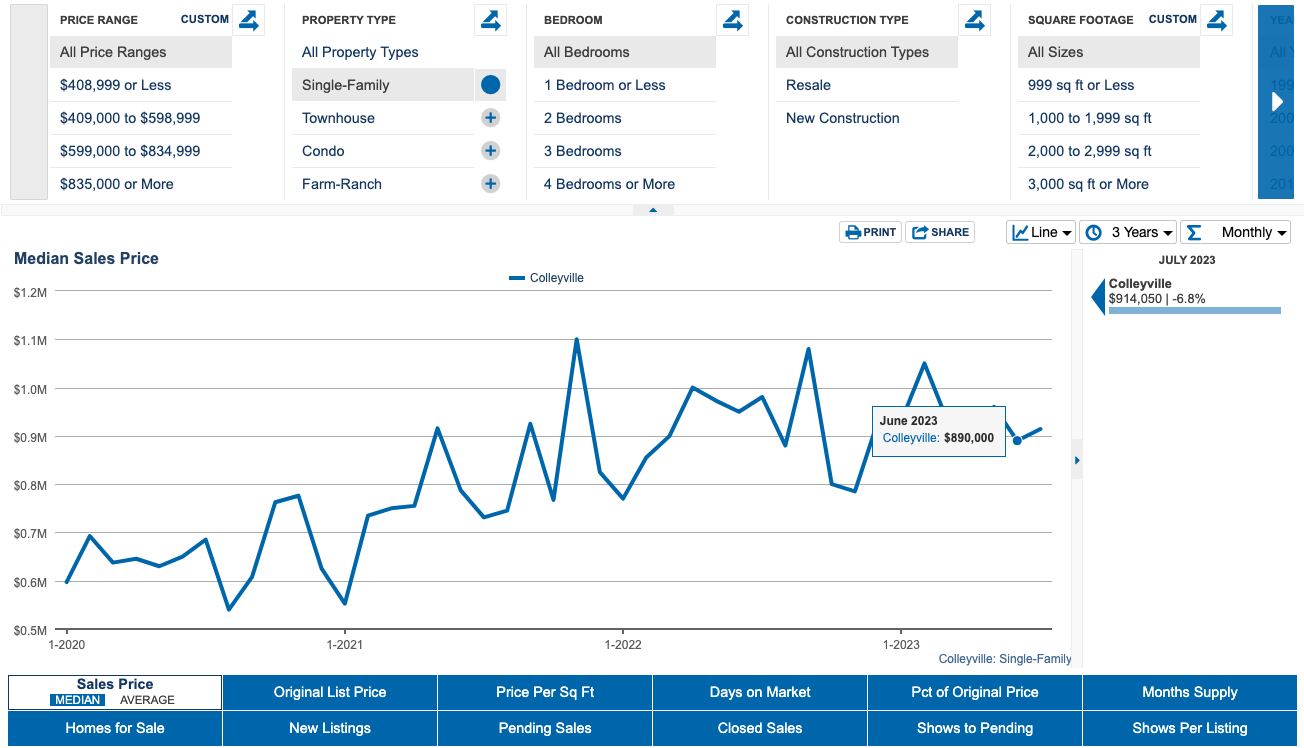
#10 on our Biggest Winners List for July 2023 is the city of Colleyville Texas, This city has a pretty high price point, as it has a great location, next to the DFW airport, Southlake, Grapevine Lake, and right between Fort Worth and Dallas.
It was UP +2.7% to a median sales price of $914k
From the peak of 2022, it is down -15%
Looking at the YTD numbers, it is DOWN -1.8%
Some of the Supply Demand metrics show:
15 Days for the Median Days on Market, up slightly from the previous month
The % of Original Price was 98.8% which was also close to Junes 99%
The Months Supply dropped to 2.7 months which was at 3.2 in June. Showing supply is tightening again.
Also the homes for sale dropped to 70, which was down 10 from Junes 80 homes for sale.
This will be a continued trend you will be seeing over the next few months as we have now began the Fall/Winter slowdown here in the DFW area.
Winner #9 - Grapevine Texas
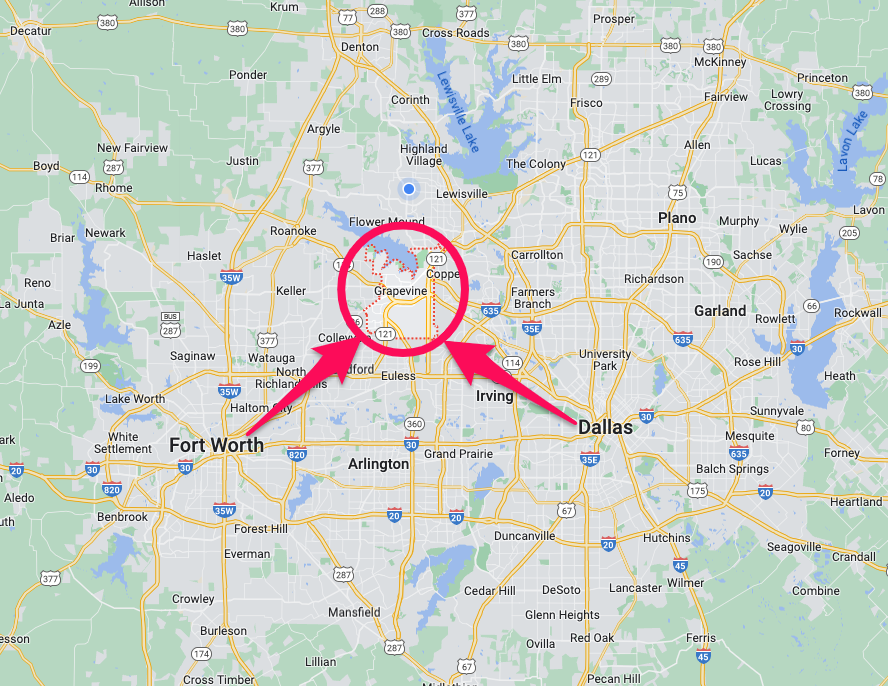
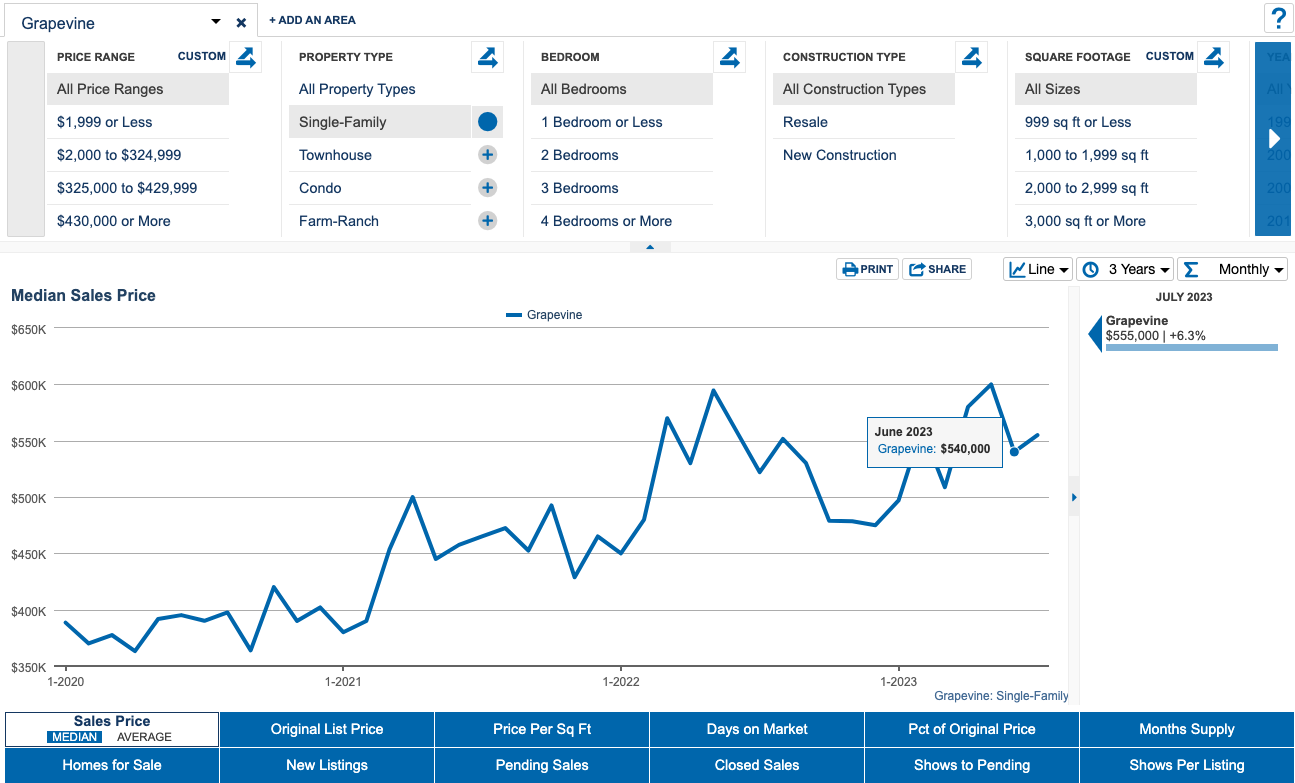
#9 is the city of Grapevine Texas, just like Colleyville it has a great location, as it is right next door to it. So location is holding up well.
It was UP +2.8% to a median sales price of $555k
From the peak of 2023 Grapevine is down -7%
Year to Date it is UP +11.7%
Days on Market is at 6 days meaning things sell quick here.
The % of OriginalPrice was 98.6% which has declined from its May high of 100.9%
The Months Supply dropped to 1.7 months and is rising.
homes for sale rose to 60, up from June reading of 54.
Winner #8 - Richardson Texas
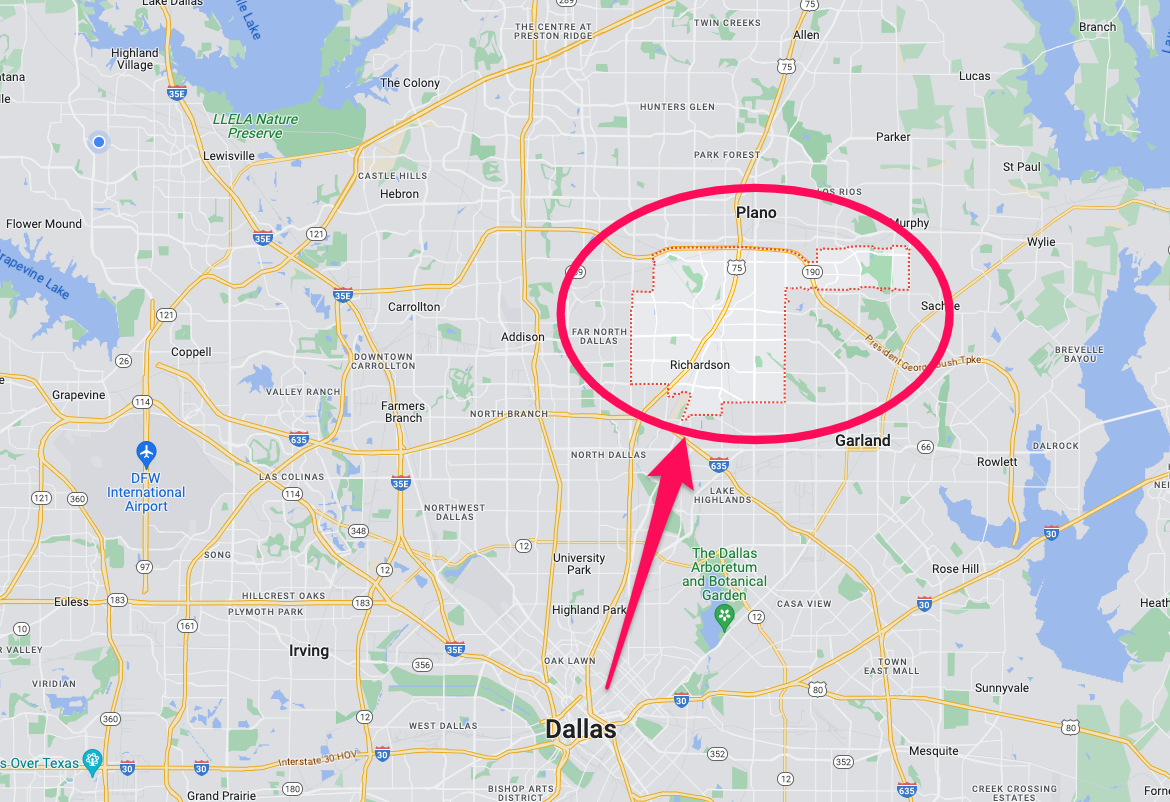
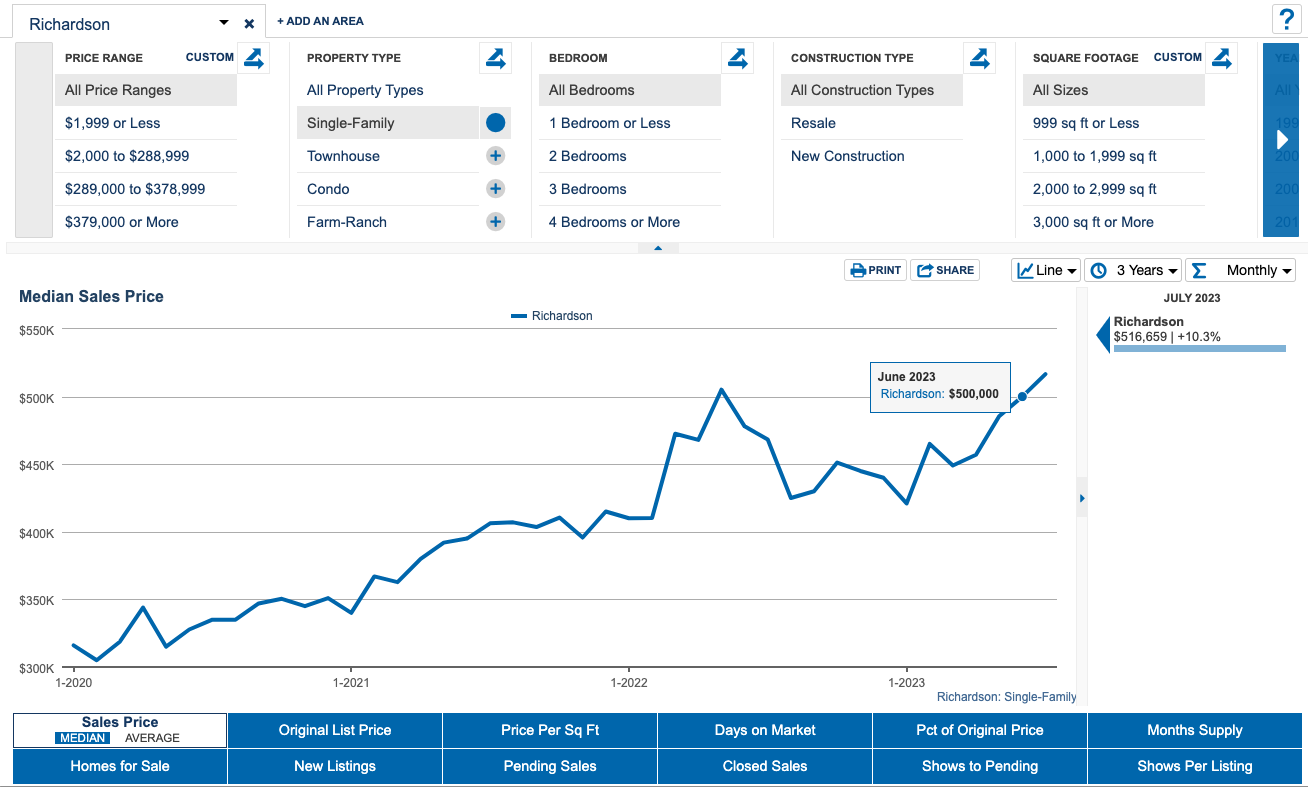
#8 is the city of Richardson Texas, close to downtown Dallas, and home to UT Dallas, this city continues to have high demand.
It was UP +3.3% to a median sales price of $517k
This is one of the few cities that is making new ALL-TIME highs, as it has regained all the market value it lost from the 2022 market decline.
Year to Date it is UP +22.7%.
Days on Market is at 9 days
The % of OriginalPrice was 100%, so sellers are in the drivers seat here.
The Months Supply was 1.6 months and is rising slightly.
homes for sale rose to 123, up from June reading of 111.
Winner #7 - Hurst Texas
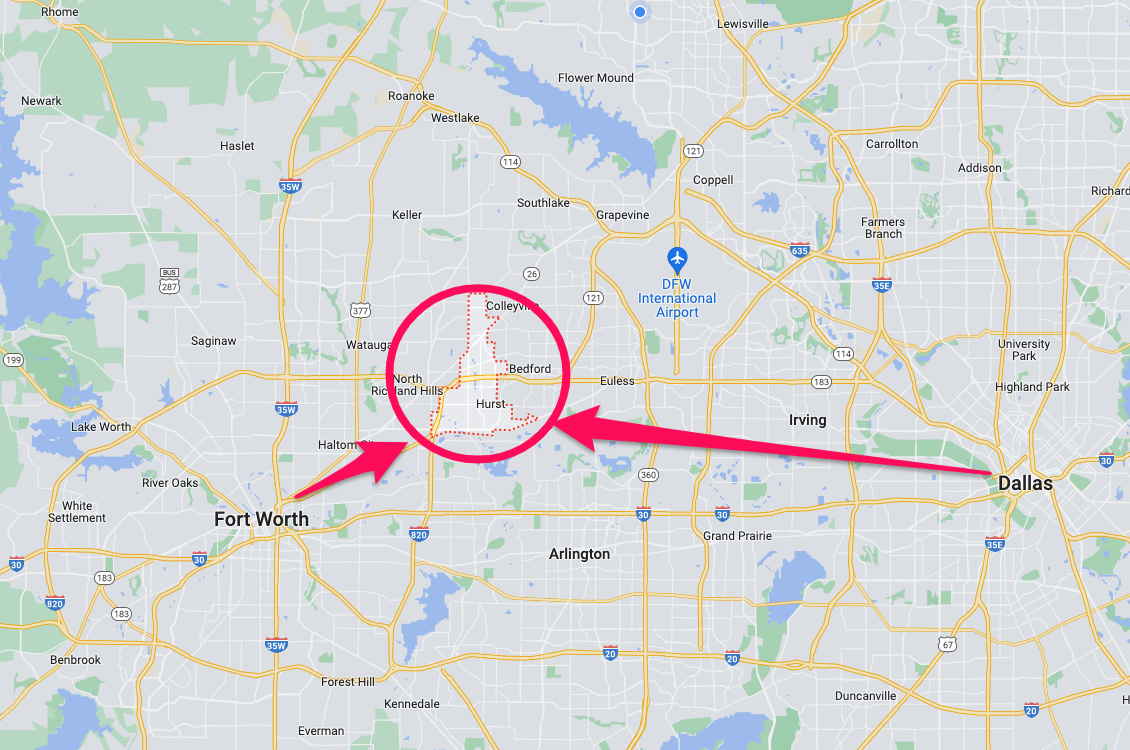
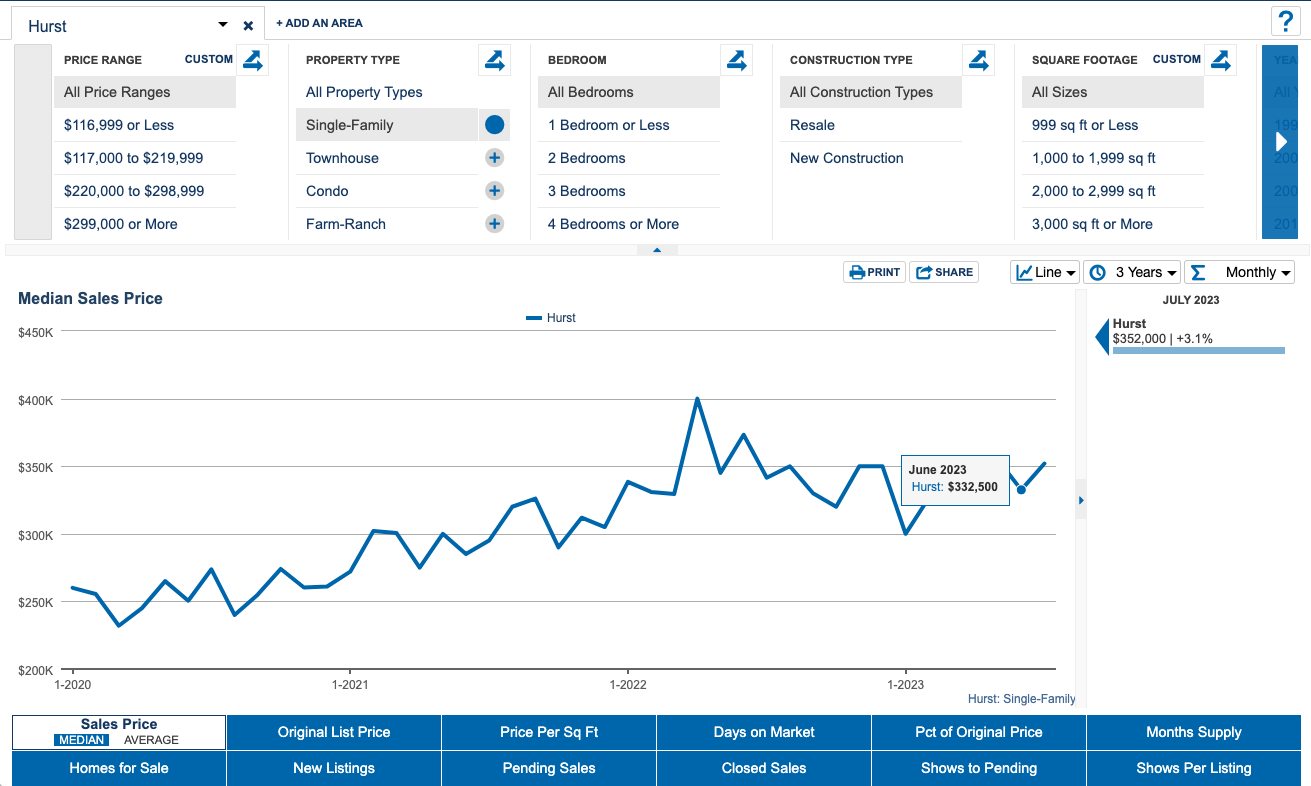
#7 is the city of Hurst Texas, again a very good location in proximity to Dallas, Fort Worth and the airport and a little more modest of a price point.
It was UP +5.9% to a median sales price of $352k
It is still down from the peak -12%
Year to Date it is UP +17.3%
Days on Market is at 10 days
The % of OriginalPrice was 100% which actually is down from Junes 101.6%
The Months Supply dropped to 1.4 months and steady.
homes for sale stayed 46 from June reading of 46.
Winner #6 - North Richland Hills Texas
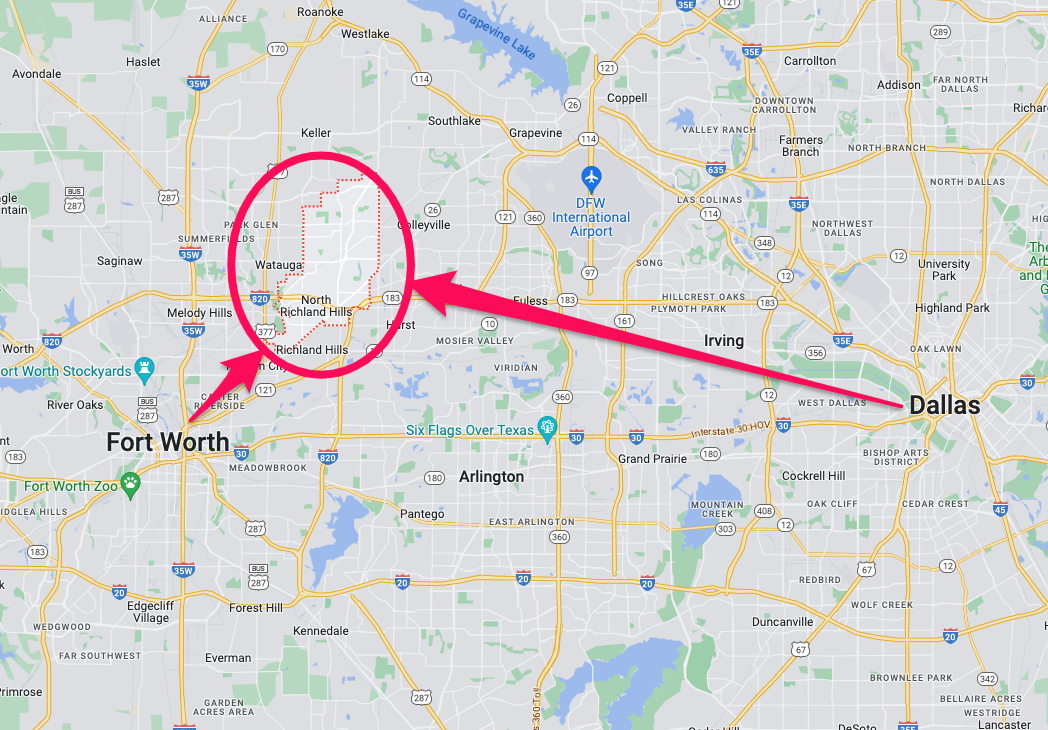
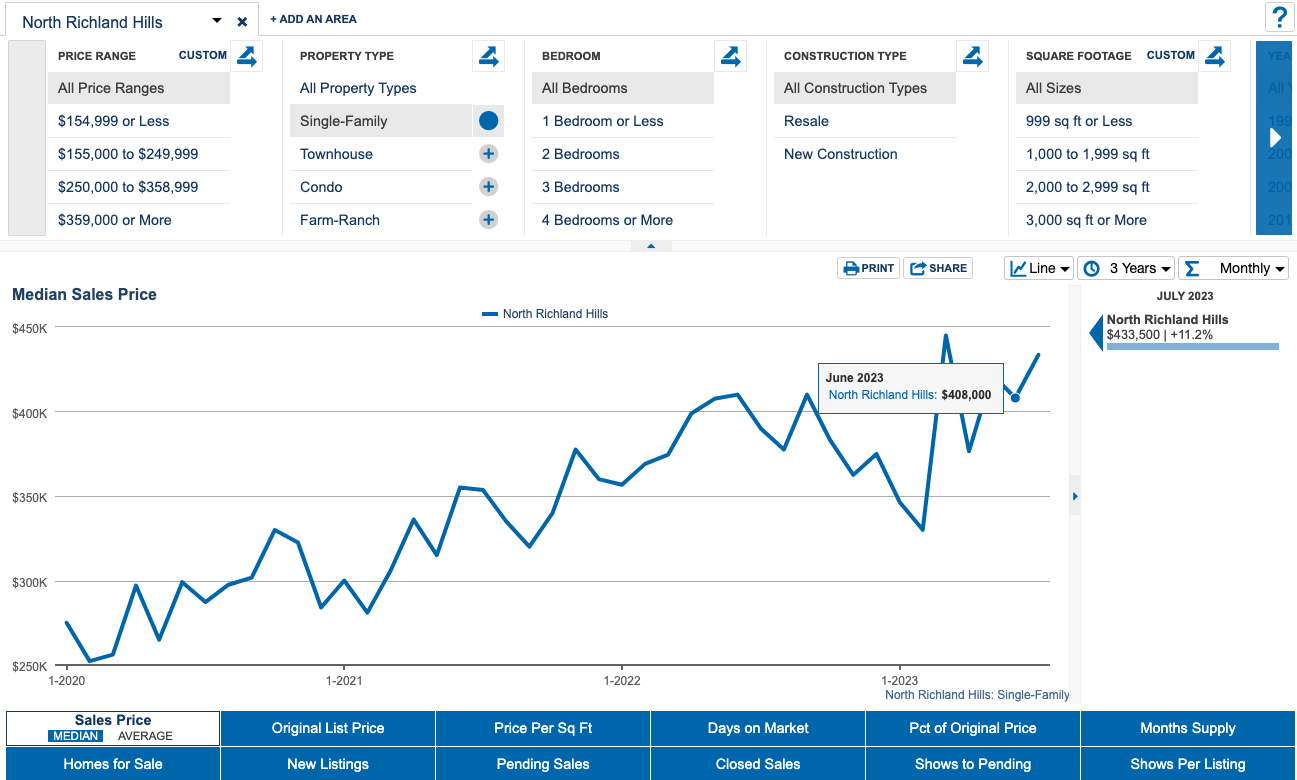
#6 is the city of North Richland Hills Texas, which has been on the list a recently. It is also right next to Hurst and Colleyville.
It was UP +6.3% to a median sales price of $434k
this one recovered from the 2022 decline to make a new high earlier in March, is making its way toward another new high.
Year to Date it is UP +25.1%, which was even better than Richardson.
Days on Market is at 8 days.
The % of OriginalPrice was 100% which was the same as May.
The Months Supply dropped to 2 months and steady.
homes for sale stayed flat at 128, same as June.
Winner #5 - Fate Texas
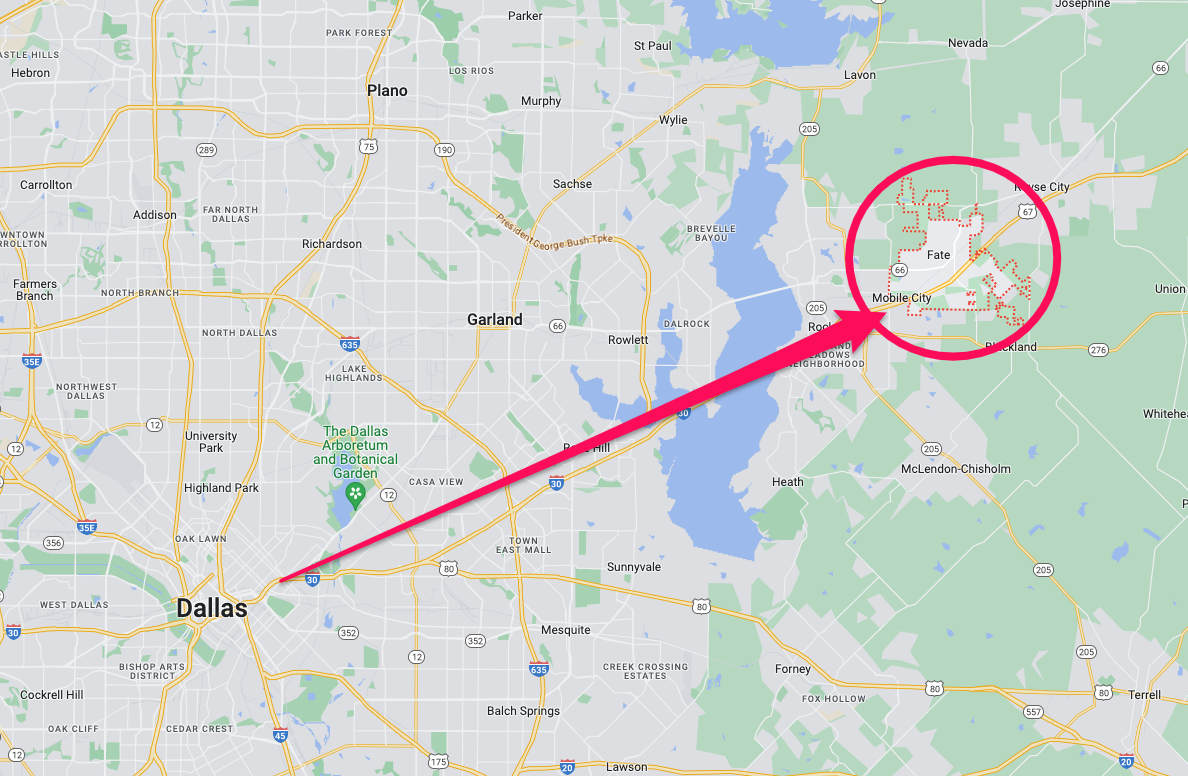
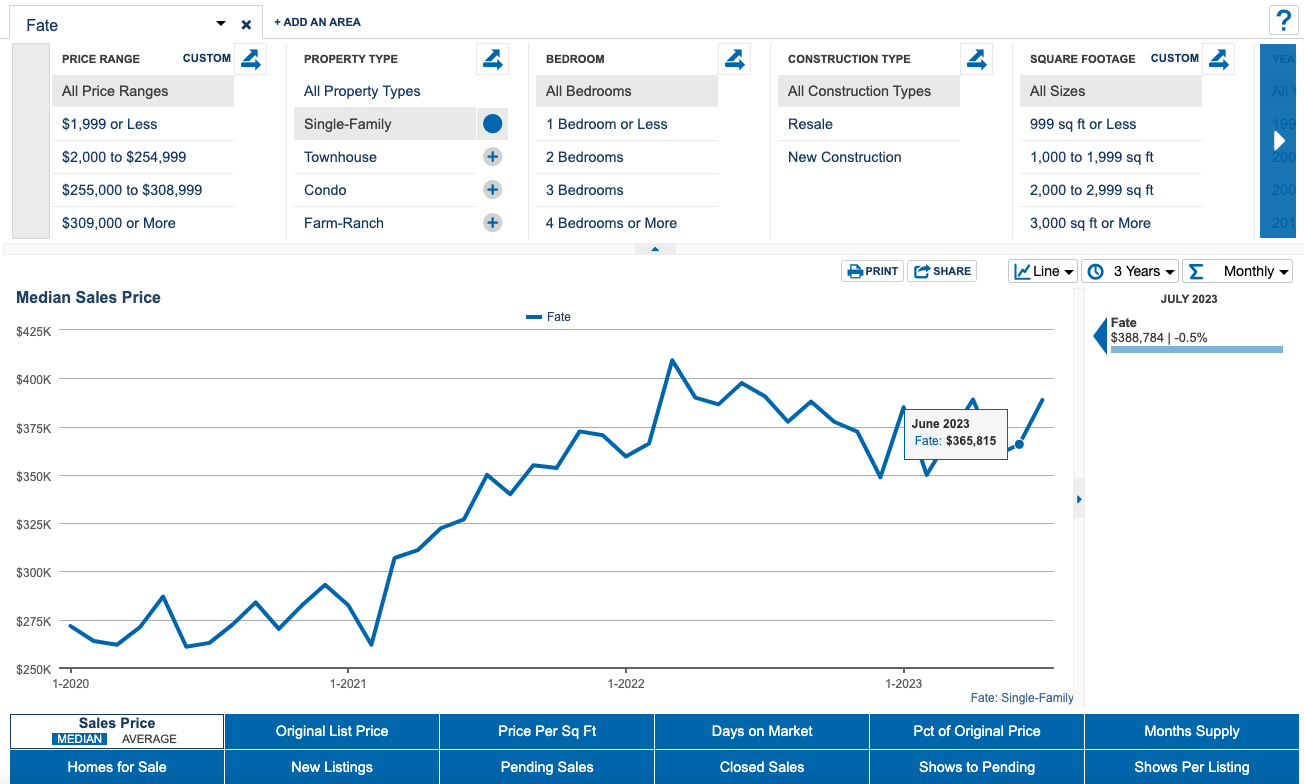
#5 is the city of Fate Texas, and is the first city on the list in the East side of Dallas so far.
It was UP +6.3% to a median sales price of $389k
From the peak it is down -6%
Year to Date it is UP +1%
Days on Market is at 27 days, up from 24 in June.
The % of OriginalPrice was 96.5% which up from May 96%
The Months Supply is at 2.8 months which is down from Junes 2.9 months
homes for sale rose to 116, which is the same as June.
Winner #4 - Prosper Texas
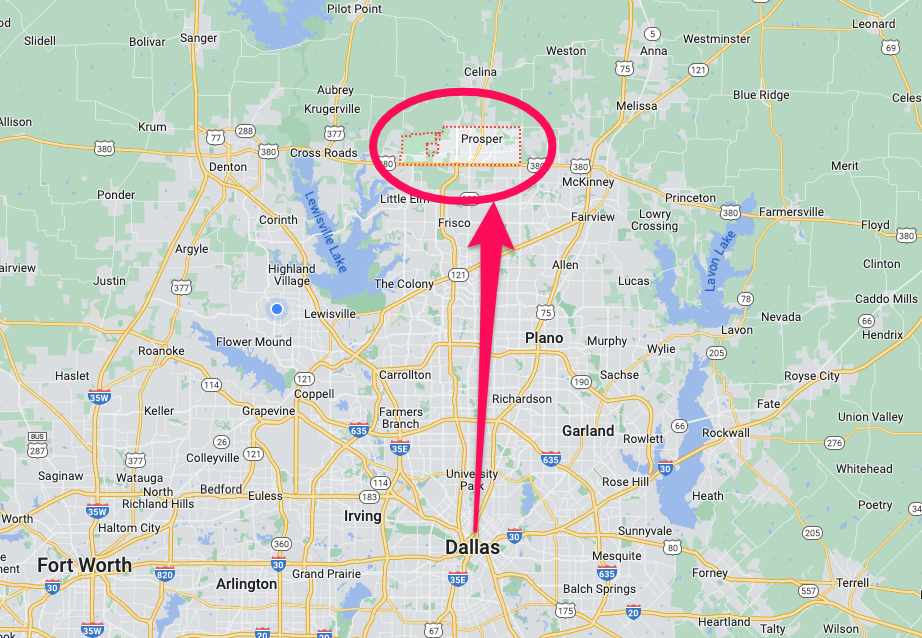
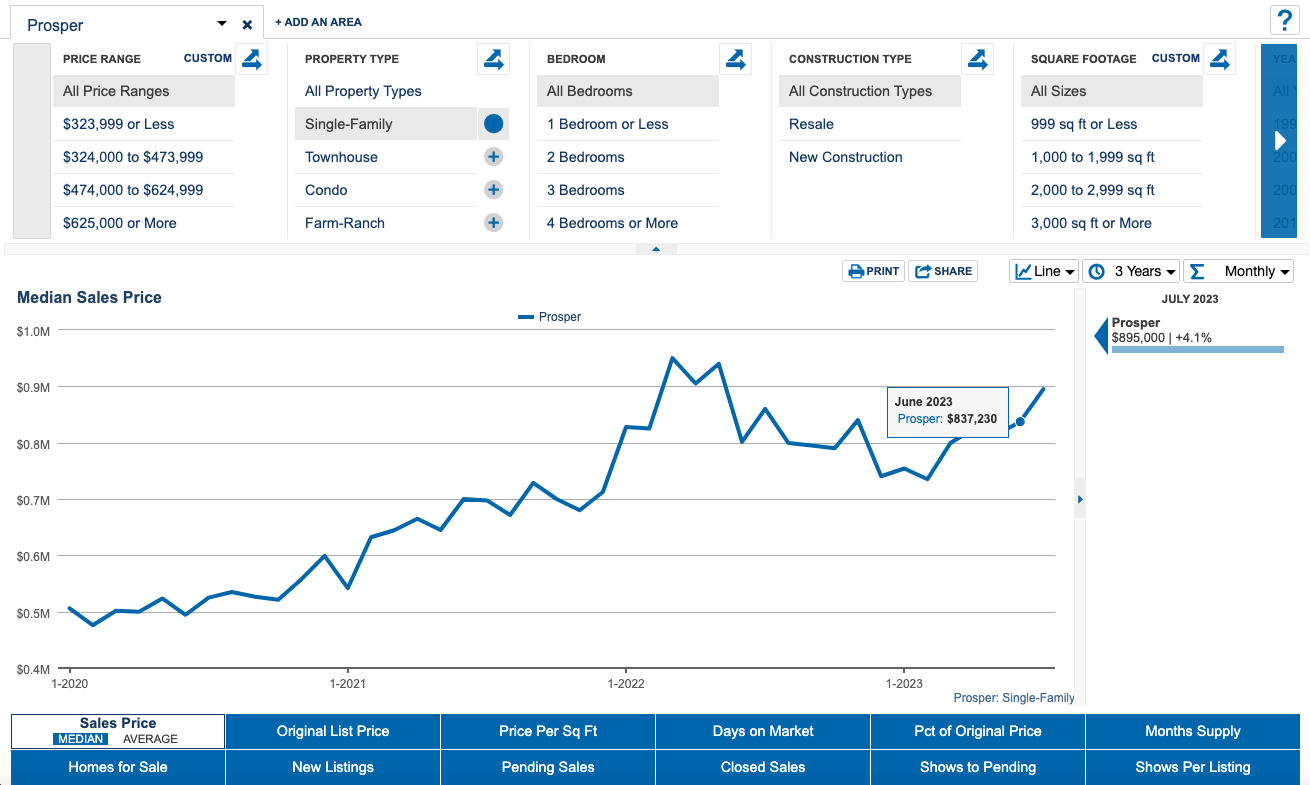
#4 is the city of Prosper Texas, so no wonder it went up in value 🙂 . This one is located in the desirable area over by Frisco Texas, and also home to the community with the blue lagoon and white sand beaches.
It was UP +6.9% to a median sales price of $895k
From the peak it is down -6%
Year to Date it is UP +18.7%
Days on Market is at 28 days
The % of OriginalPrice was 97.5% down from Junes 98.3%
The Months Supply rose to 2.9 months and is rising.
homes for sale rose to 224, up from June reading of 223
Winner #3 - Argyle Texas
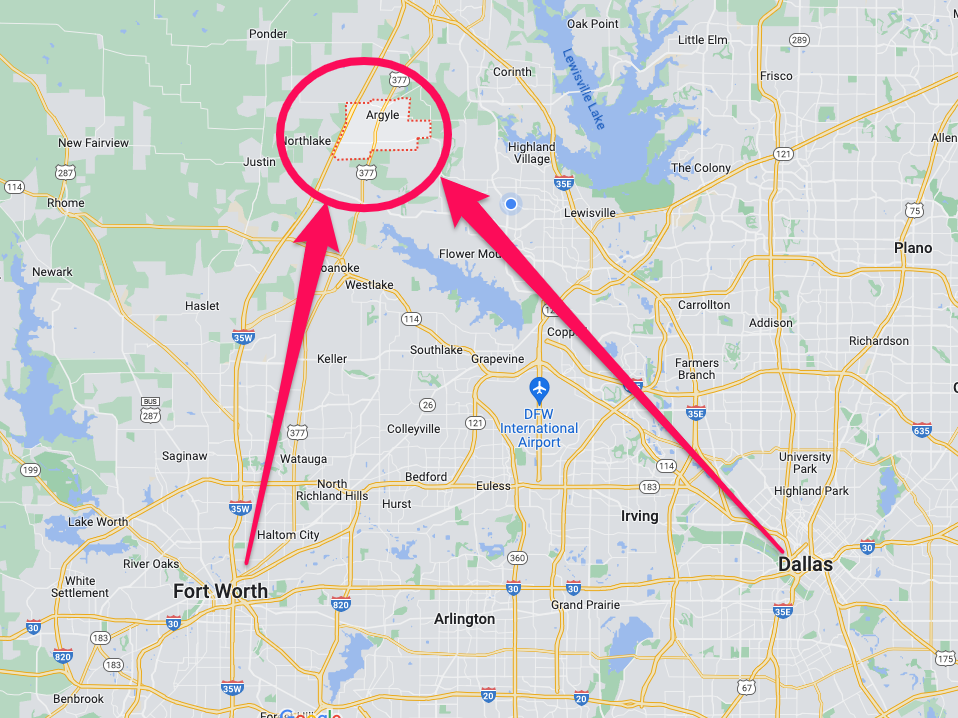
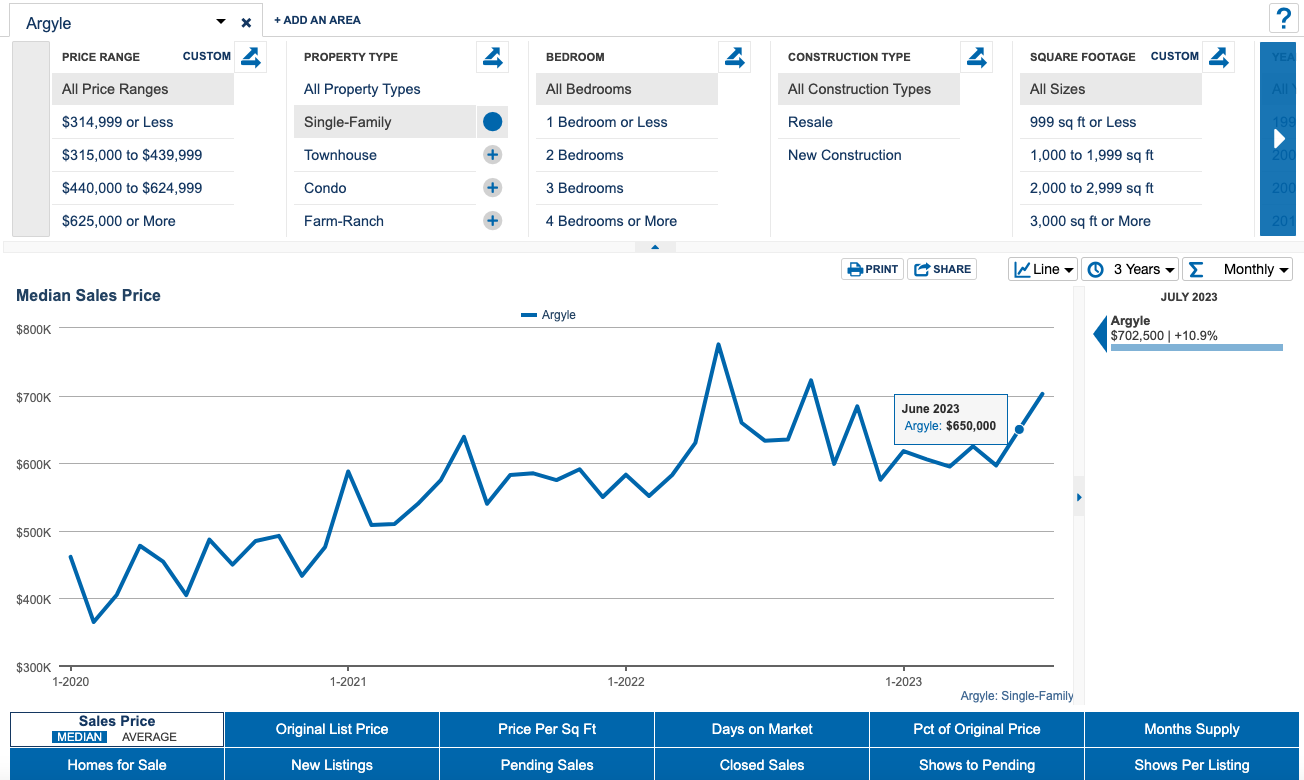
#3 is the city of Argyle Texas, which is out in a bit more rural area, there are some beautiful ranches, and also some great new master planned communities that are going in.
It was UP +8.1% to a median sales price of $703k
From the peak it is down -9%
Year to Date it is UP +13.7%
Days on Market is at 15 days
The % of OriginalPrice was 97.4% up from Junes 96.6%
The Months Supply is at 4.2 months and is rising.
homes for sale rose to 144, down from Junes 145.
Winner #2 - Southlake Texas
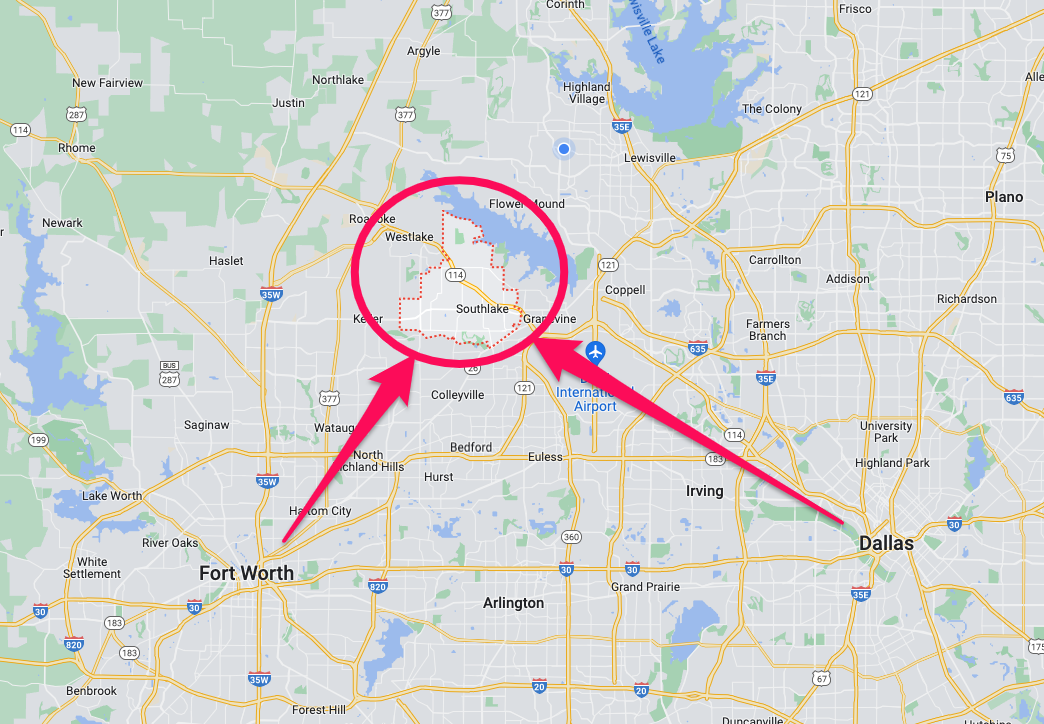
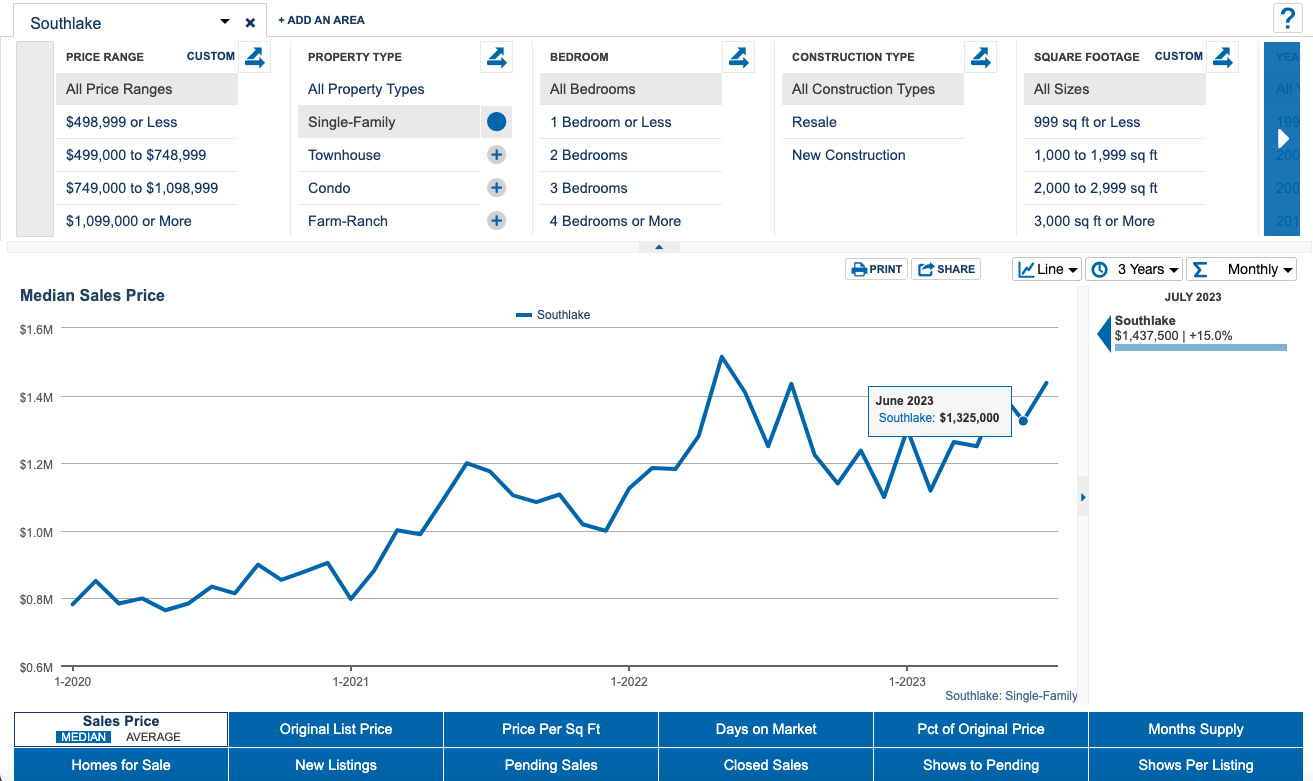
#2 is the city of Southlake Texas, this is the highest price point in the Biggest winners, and does have the top ranked school district according to Niche.com for 2023.
It was UP +8.5% to a median sales price of $1.4 Million
From the peak it is only down -5% now.
Year to Date it is UP +10.6%
Days on Market is at 18 days
The % of OriginalPrice was 96.2% down from Junes 97.7%
The Months Supply rose to 3.3 months and is rising.
homes for sale rose to 111, up from June reading of 106
Winner #1 - Azle Texas
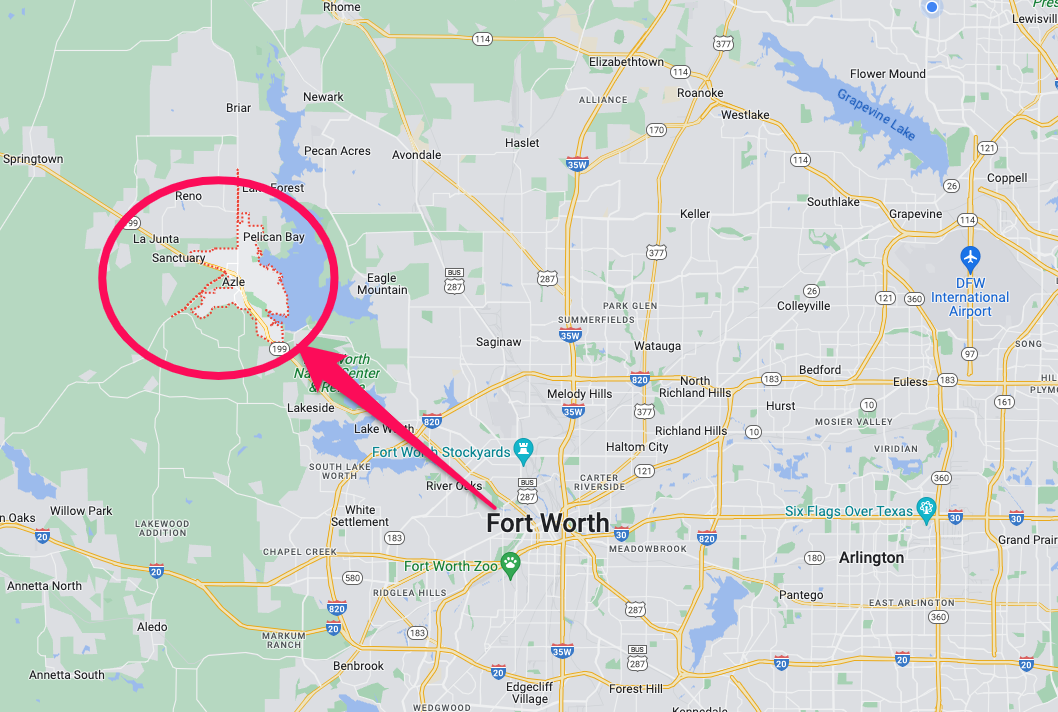
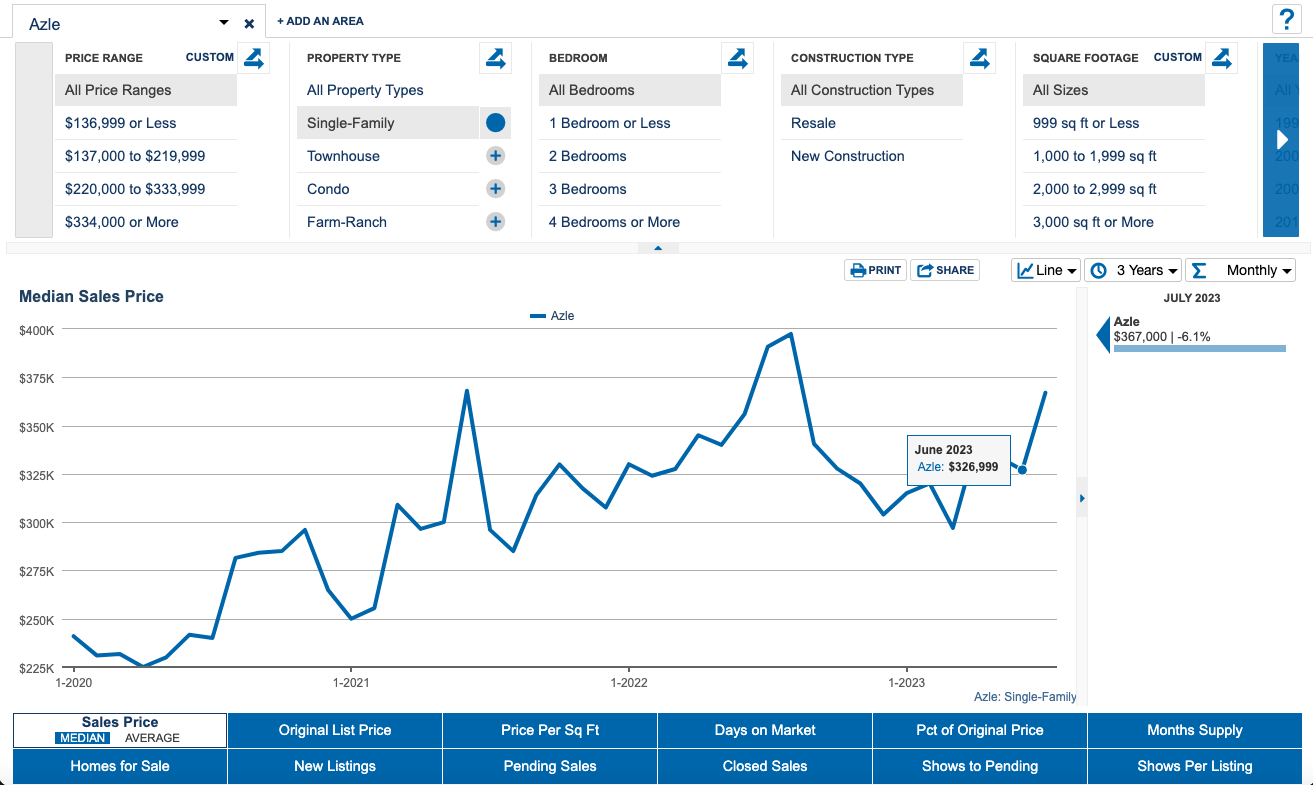
That brings us to the big dog for July, #1 is the city of Azle Texas, which is way out to the west in the DFW metro area.
It was UP +12.2% to a median sales price of $367k
From the peak it is down -6%
Year to Date it is UP +16.5%
Days on Market is at 38 days and rising
The % of OriginalPrice was 97.8%, down from Junes 99%
The Months Supply rose to 4.8 months and is rising and is approaching a balanced market level.
homes for sale rose to 199, up from June reading of 173.
Biggest Losers July 2023
Loser #10 - Dallas Texas
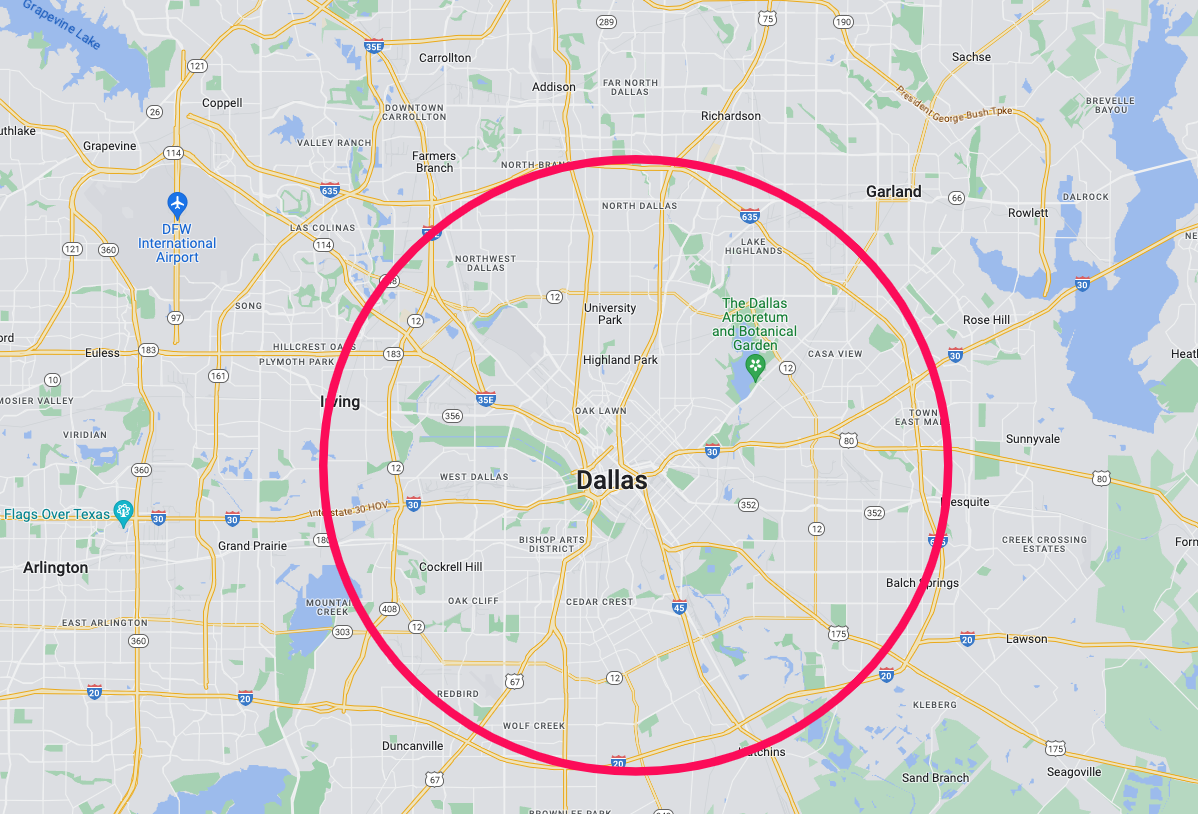
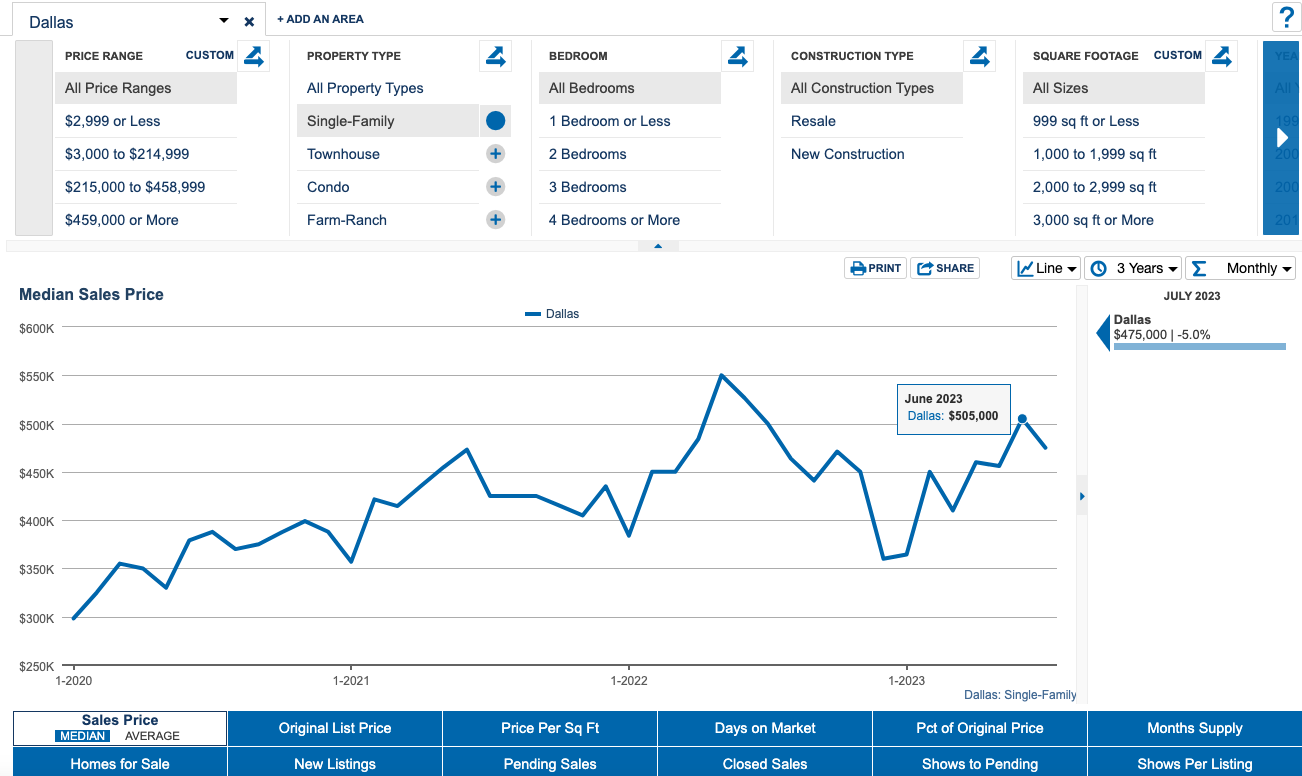
#10 is the city of Dallas Texas, which was on the winners list last month. As you can imagine, this is a driver for the DFW area. So could be the indication of some softening in the near future. Or maybe it just went up too much last month and needed to retrace a bit. May be a little of both. Either way, its something to keep an eye on.
It was DOWN -5.9% to a median sales price of $475k
Dallas is down -14% from its peak
Year to Date it is UP +29.4%. Which is huge, so a retrace is not unreasonable.
Days on Market is at 13 days
The % of OriginalPrice was 98.6%, and declining.
The Months Supply rose 2.6 months which is also rising from the previous months
homes for sale rose to 1643, up from June reading of 1596.
Loser #9 - McKinney Texas
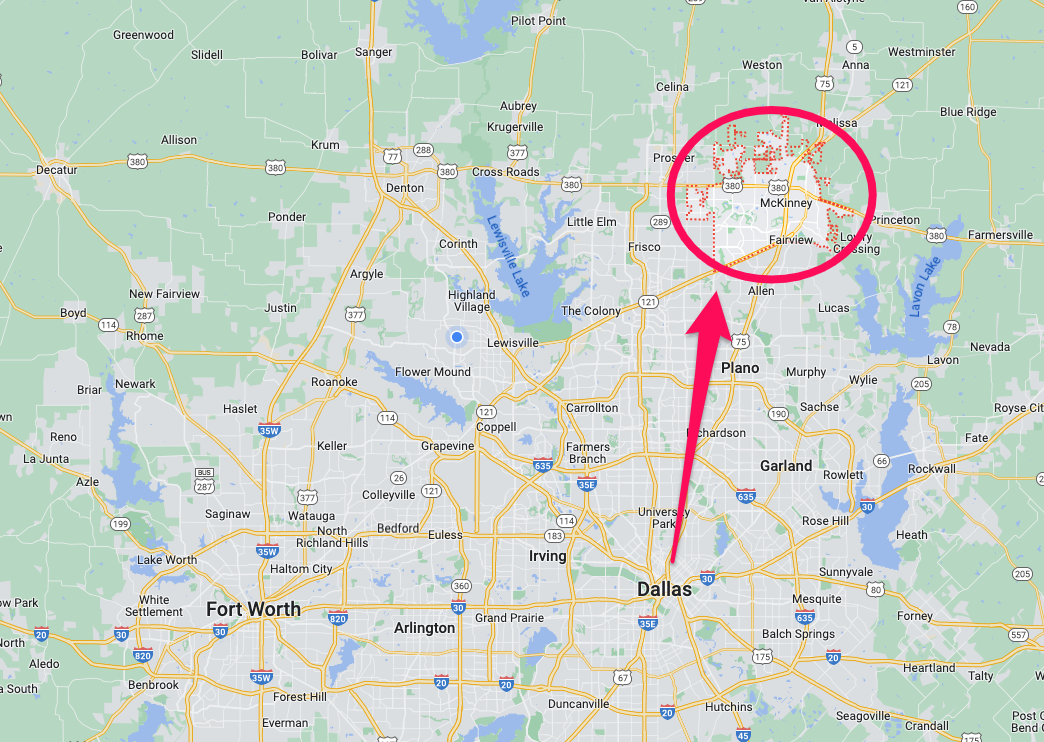
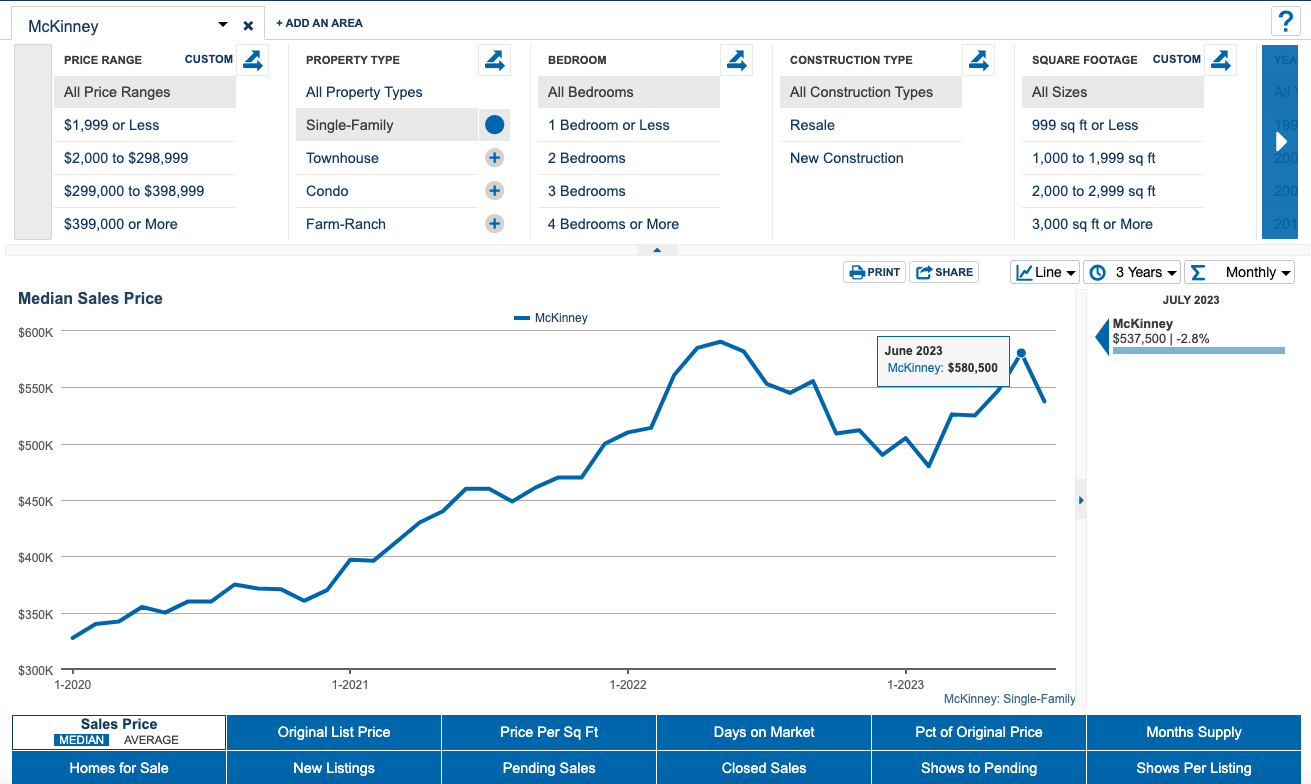
#9 is the city of McKinney Texas, located up in the Northeast of the DFW Metro area.
It was DOWN -7.4% to a median sales price of $538k
it is down -16% from its peak
Year to Date it is UP +14.4%.
Days on Market is at 14 days and steady
The % of OriginalPrice was 99.9% and also steady.
The Months Supply rose 2 months which is up from Junes 1.9
homes for sale rose to 438, up from June reading of 425.
Loser #8 - Irving Texas
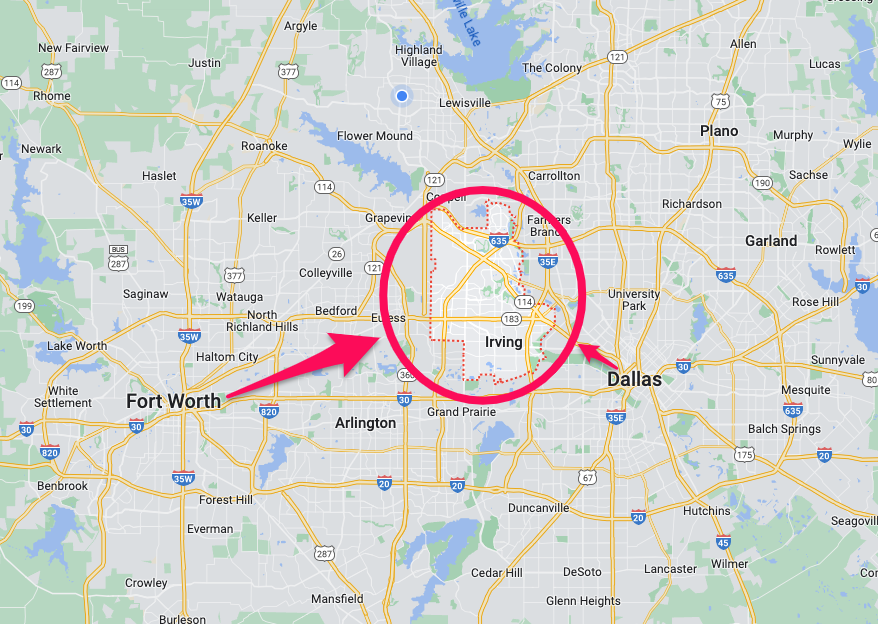
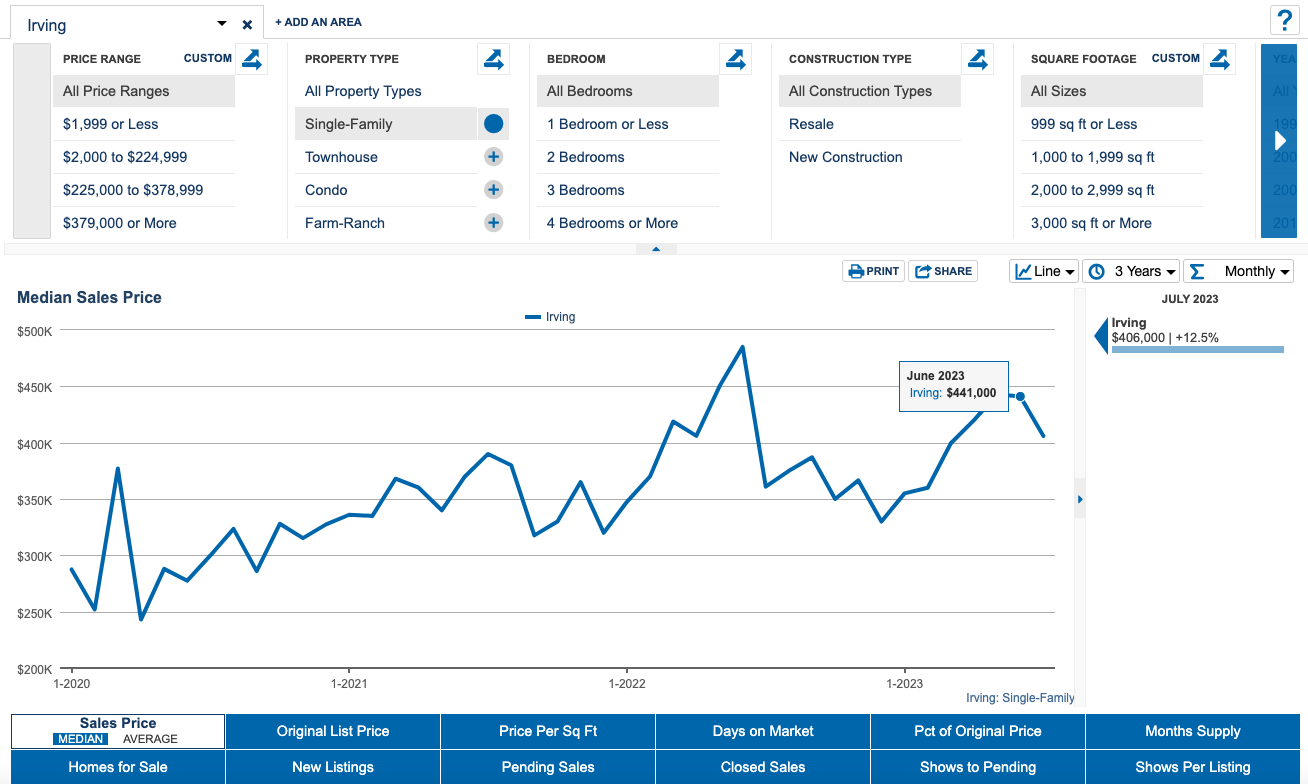
#8 is the city of Irving Texas, which had been on a huge run this year until May 2023
It was DOWN -7.9% to a median sales price of $406k
it is down -16% from its peak
Year to Date it is UP +14.4%.
Days on Market is at 9 days
The % of OriginalPrice was 100% and steady.
The Months Supply rose 1.9 months which is up from Junes 1.4
homes for sale rose to 146, up from June reading of 120.
Loser #7 - Celina Texas
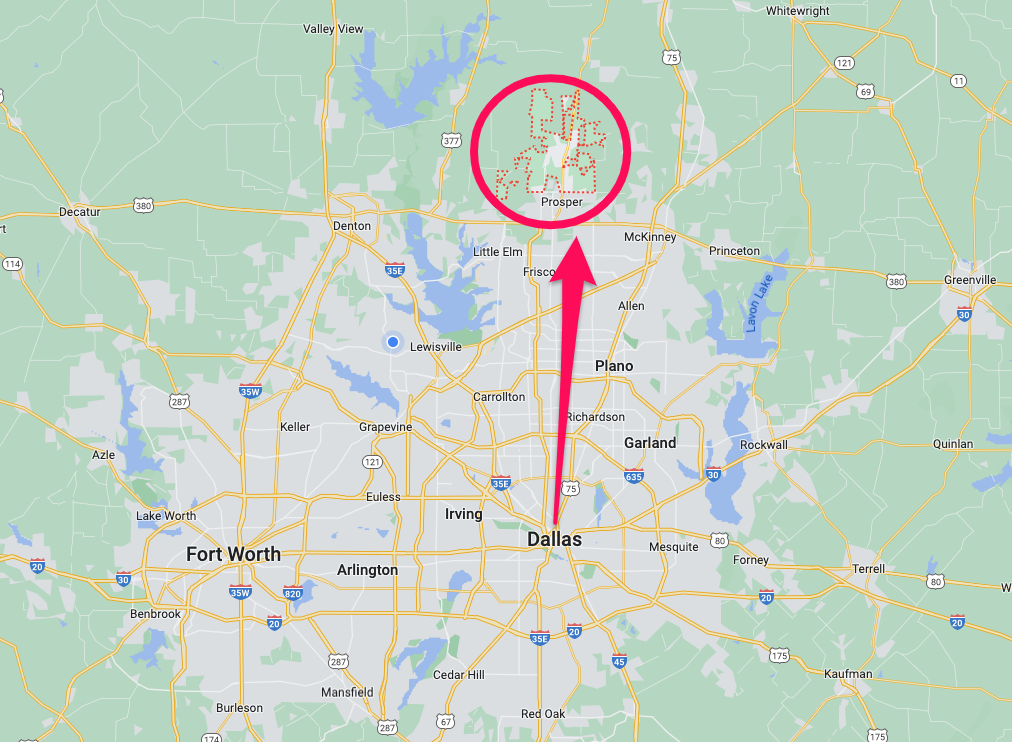
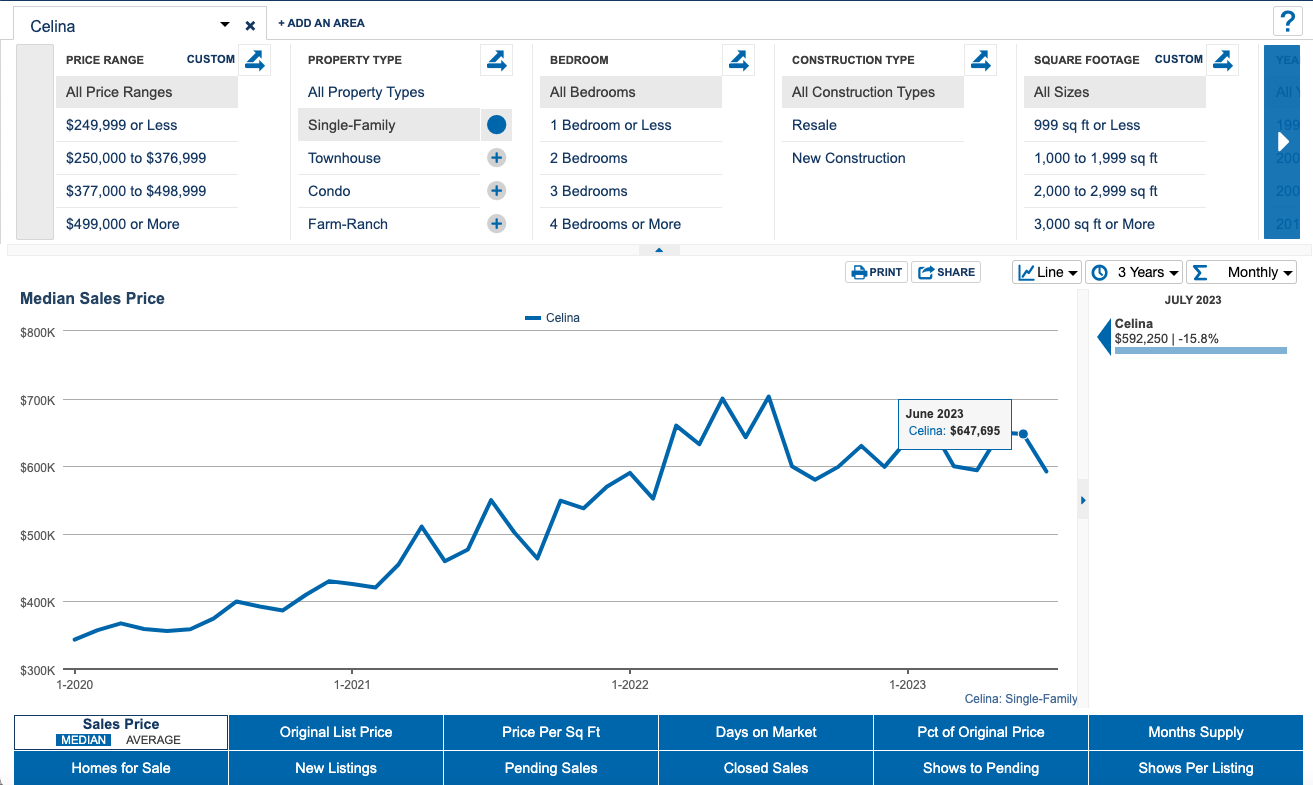
#7 is the city of Celina Texas. Which is way North of Dallas, above Frisco Texas and Prosper Texas.
It was DOWN -8.6% to a median sales price of $592k
it is down -16% from its peak
Year to Date it is DOWN -7.5%.
Days on Market is at 26 days
The % of Original Price was 98.1% which is up from Junes 97.7%
The Months Supply declined to 3 months also down from Junes 3.1 months
homes for sale rose to 281, up from June reading of 278.
Loser #6 - Corinth Texas
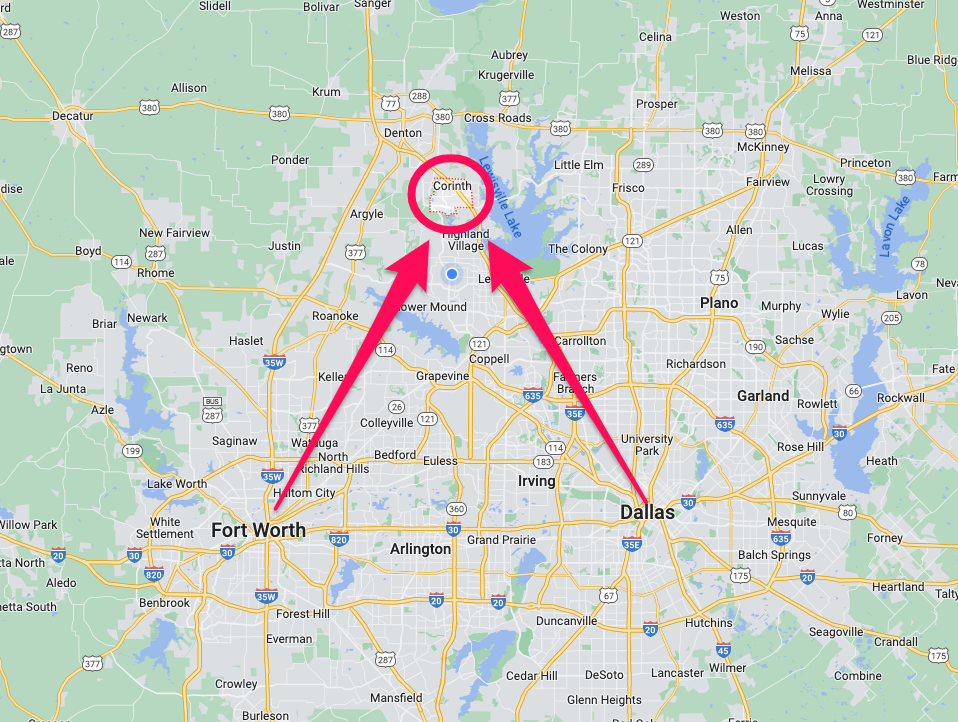
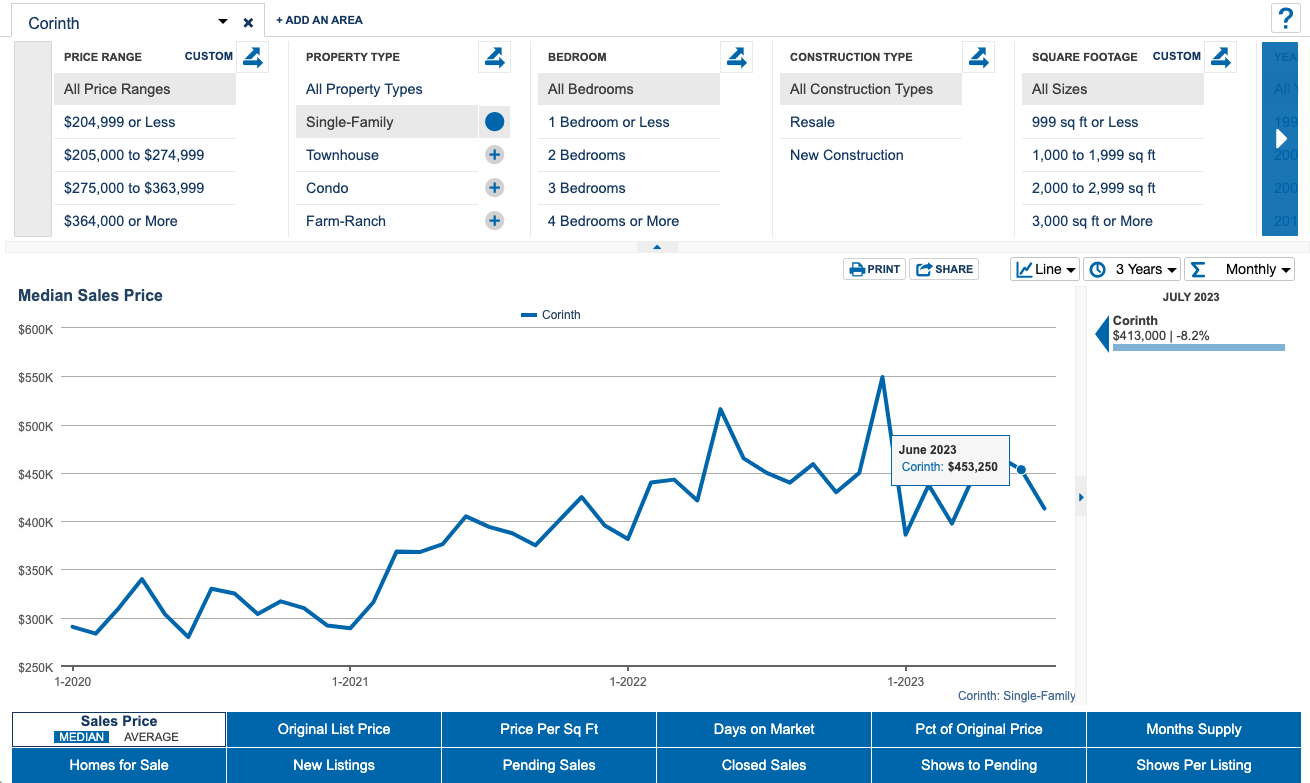
#6 is the city of Corinth Texas. Located Northwest of Dallas.
It was DOWN -9% to a median sales price of $413k
it is down -26% from its peak, which is one of the biggest drops.
Year to Date it is UP +6.9%.
Days on Market is at 13 days
The % of OriginalPrice was 98.9% down from Junes 100%
The Months Supply declined to 3.3 months from Junes 3.4
homes for sale rose to 86, up from June reading of 88.
Loser #5 - Allen Texas
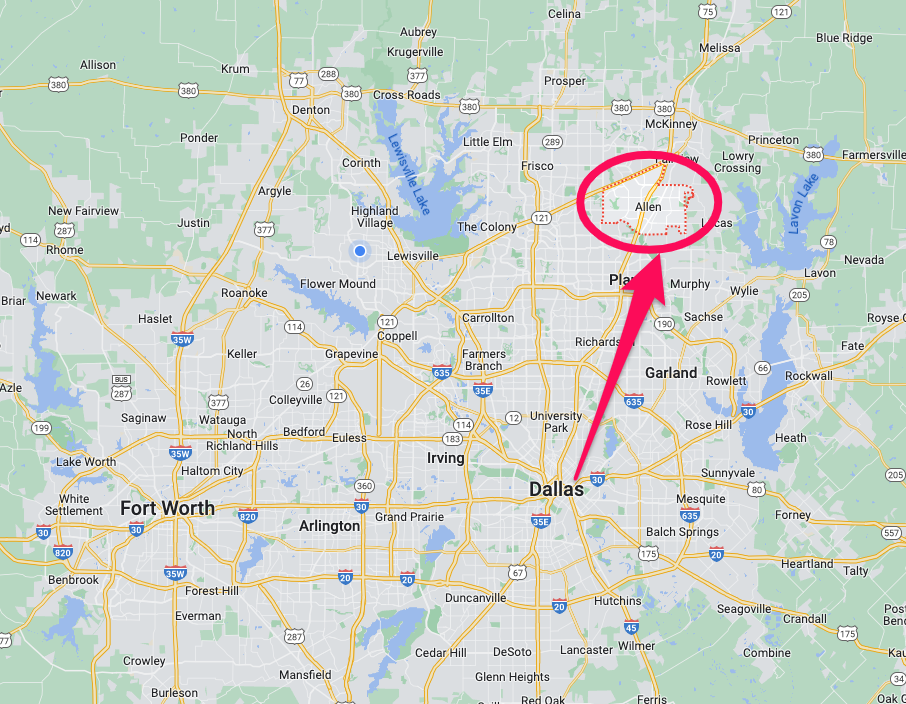
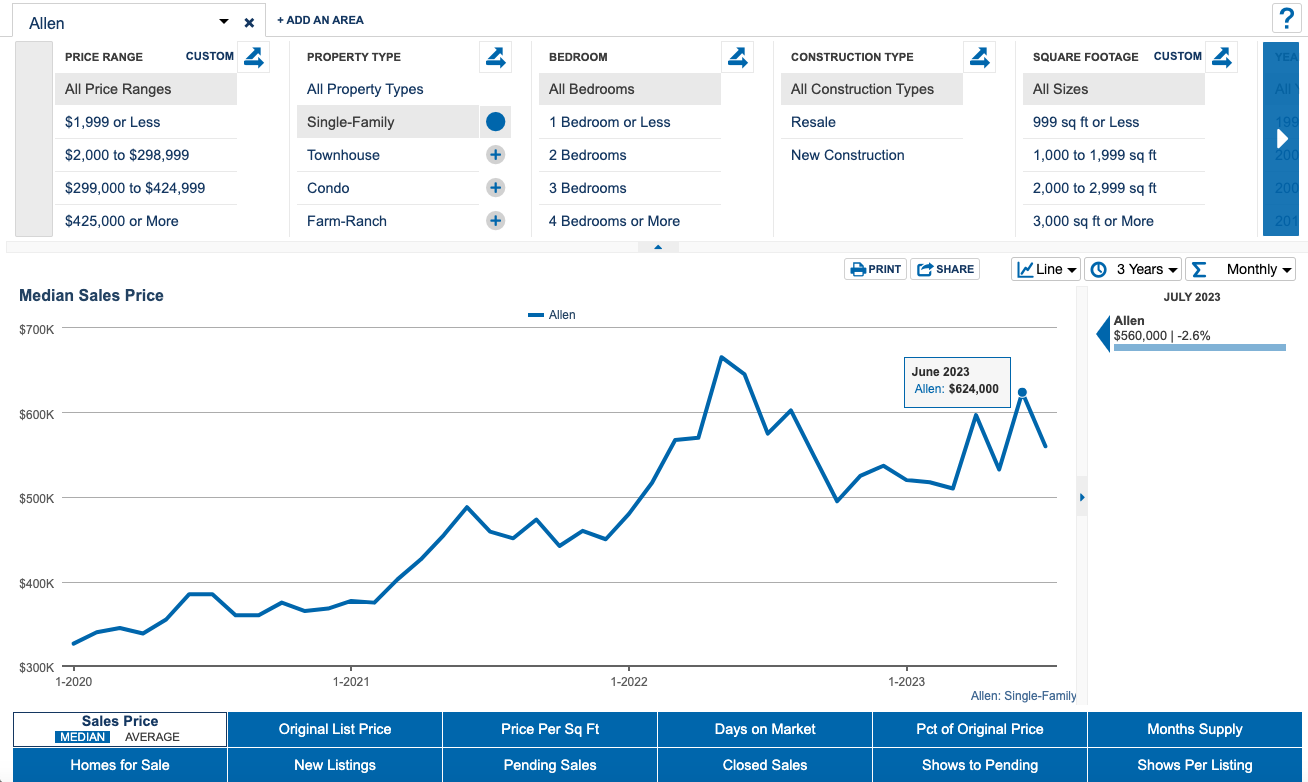
#5 is the city of Allen Texas which is on many peoples wish list, located near Frisco, Plano and McKinney. It is also home to the largest High School in the State of Texas with over 5,300 students and 2023's graduating class of 1,767 students.
It was DOWN -10.3% to a median sales price of $560k
it is down -16% from the peaks
Year to Date it is UP +6.9%.
Days on Market is at 7 days
The % of OriginalPrice was 100% same as June
The Months Supply rose to 1.8 months up from June 1.4
homes for sale rose to 145, up from June reading of 119.
Loser #4 - Little Elm Texas
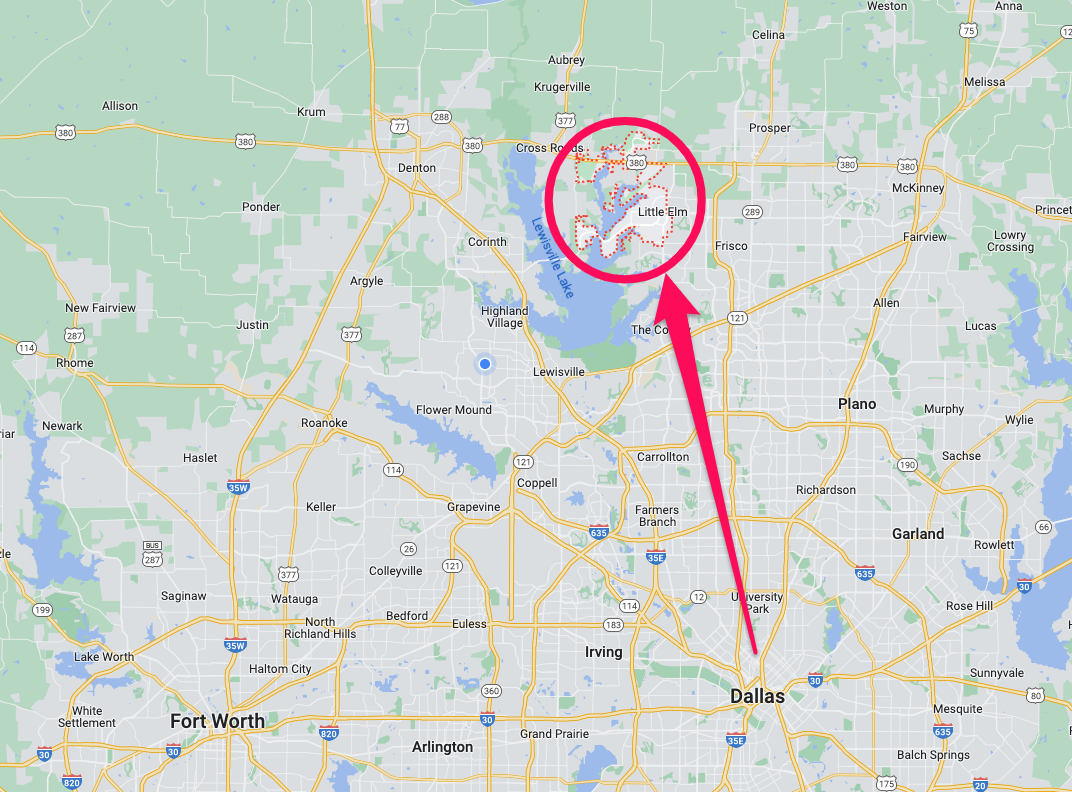
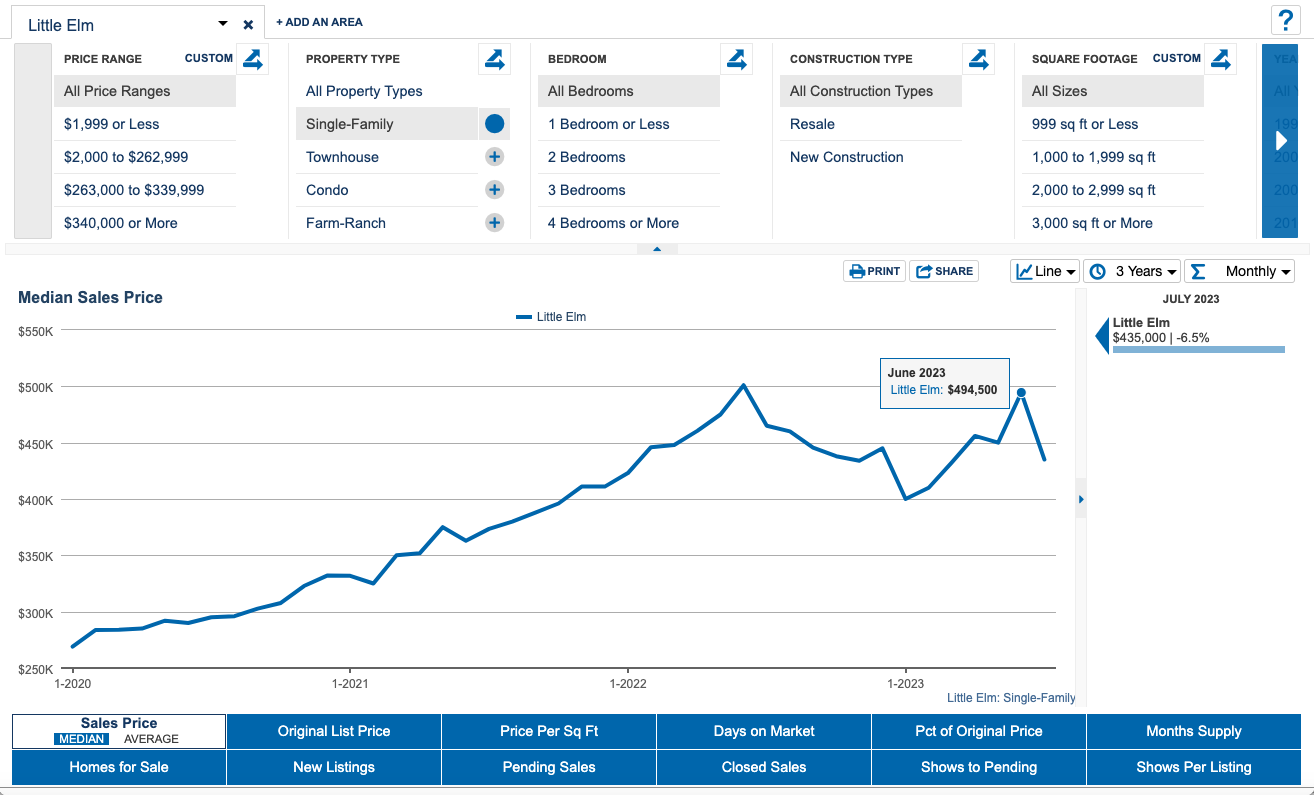
#4 is the city of Little Elm Texas which was on the June Winners list. This Lake Community stumbled a bit in July.
It was DOWN -12% to a median sales price of $435k
it is down -13% from the peaks
Year to Date it is UP +8.8%.
Days on Market is at 18 days down slightly from Junes 19 days
The % of OriginalPrice was 98.6% same as June
The Months Supply rose to 2.5 months up from June 2.4
homes for sale rose to 268, up from June reading of 262.
Loser #3 - Haslet Texas
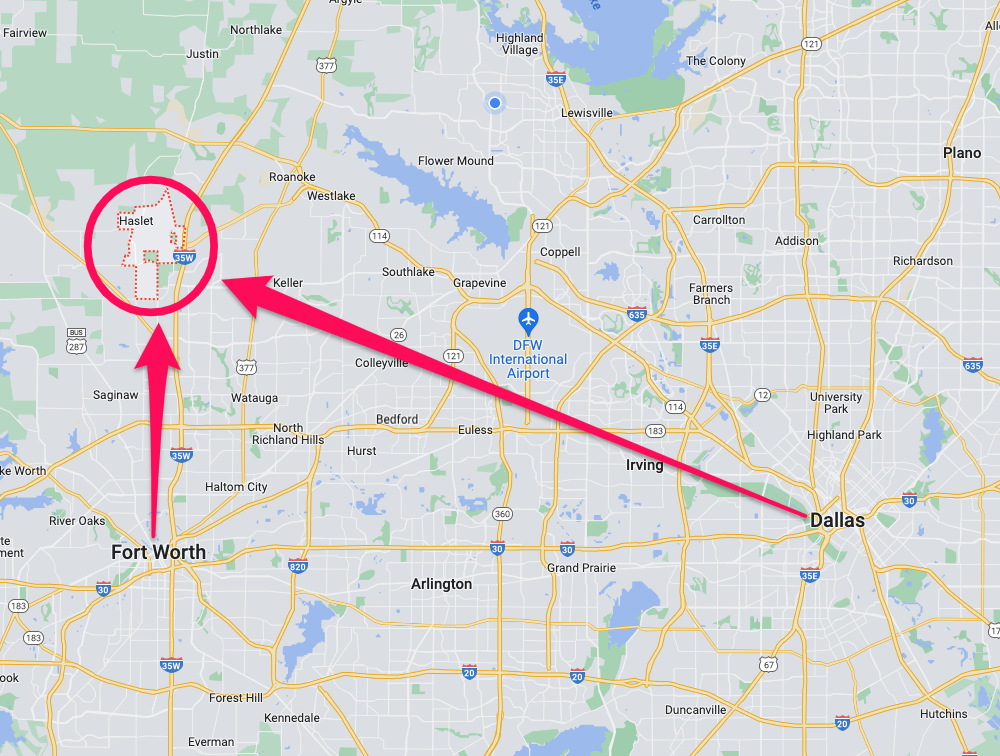
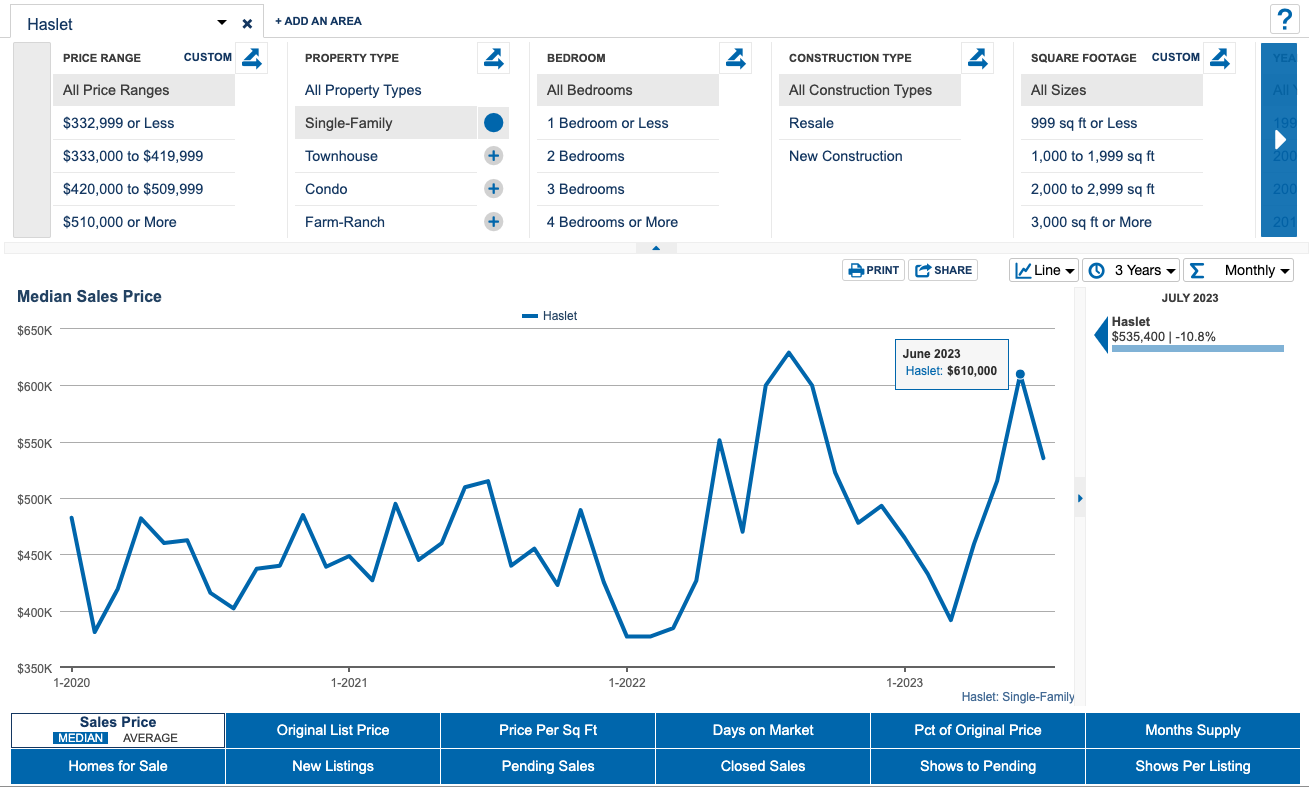
#3 is the city of Haslet Texas which was also on the June Winners list. Located way out to the West of Dallas and just North of Fort Worth
It was DOWN -12.4% to a median sales price of $535k
it is down -15% from the peak
Year to Date it is UP +15%.
Days on Market is at 40 days up from Junes 30 days
The % of Original Price was 97.5% which is up from Junes 96.1%
The Months Supply rose to 3.7 months down slightly from Junes 3.8
homes for sale dropped to 132, from June reading of 135.
Loser #2 - Lewisville Texas
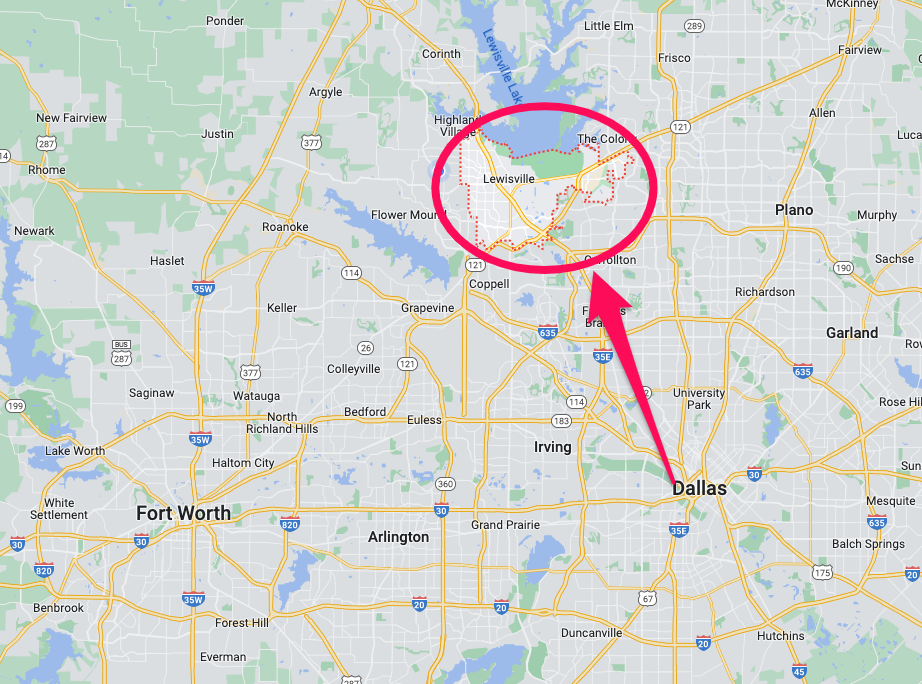
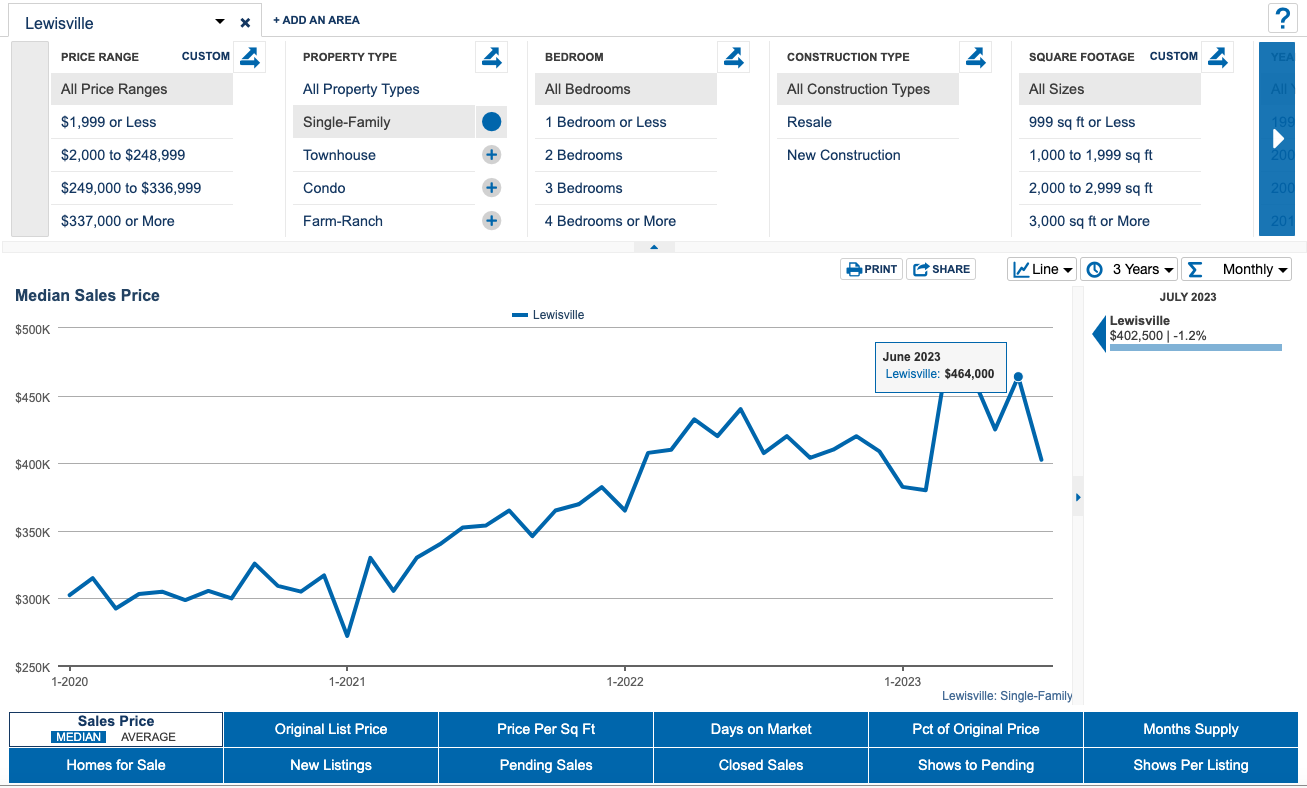
#2 is the city of Lewisville Texas also a winner last month, dropped right back to earth and could be heading back to its 2023 low from the housing down turn.
It was up DOWN -13.3% to a median sales price of $403k
it is down -9% from the peak
Year to Date it is UP +5.2%.
Days on Market is at 7 days same as June
The % of Original Price was 100% same since March
The Months Supply rose to 1.9 months and continuing to rise
homes for sale rose to 131, up from June reading of 123.
Loser #1 - The Colony Texas
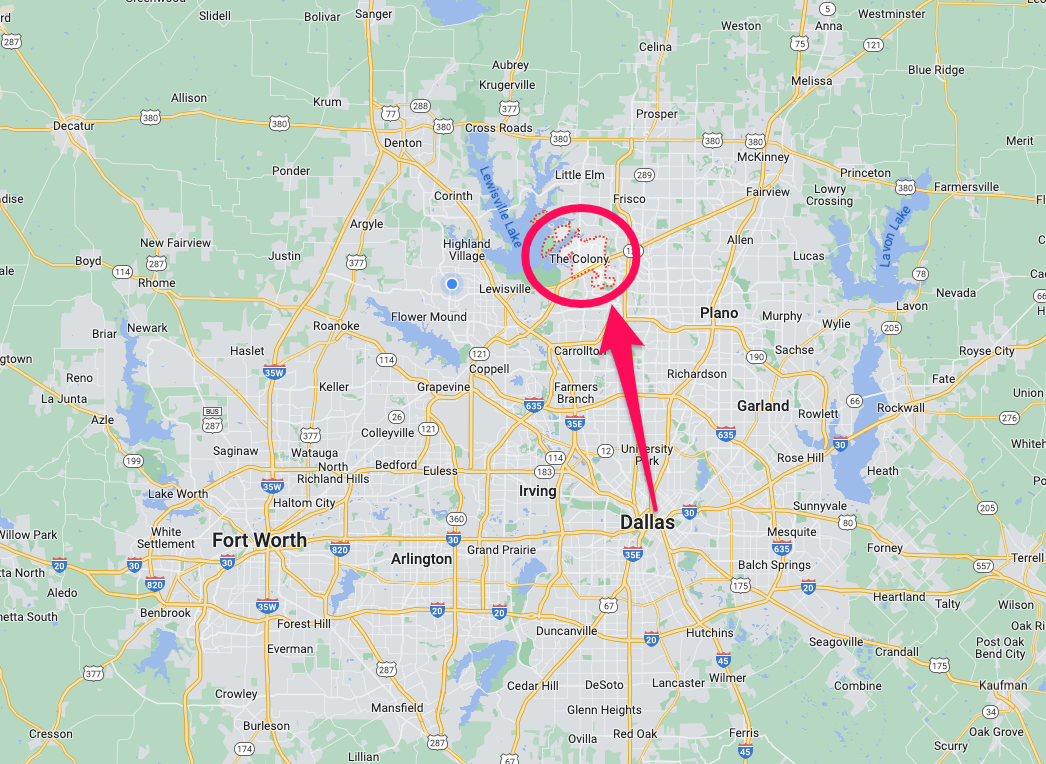
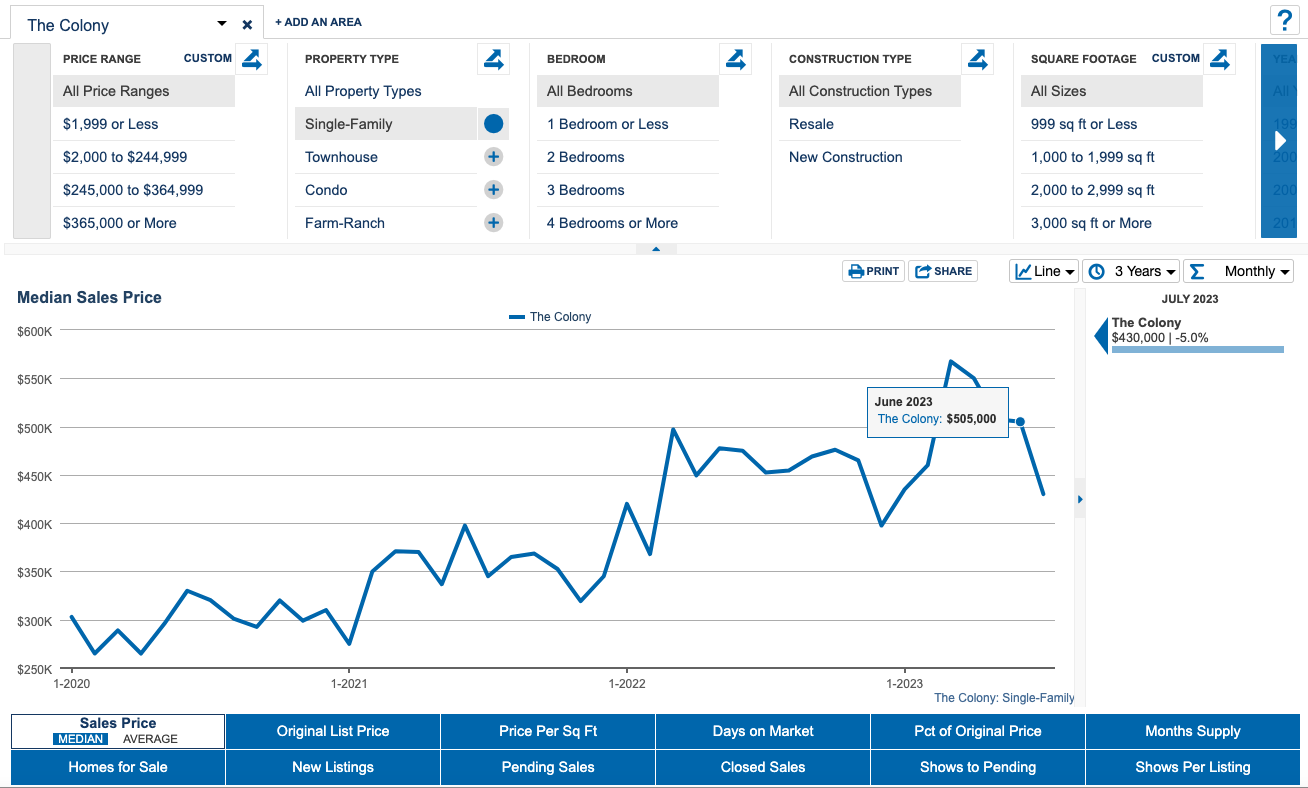
Finally the #1 Loser for July is The Colony Texas, which has been in the Southbound Express Lane since March. It is approaching the low in December 2022. So if your looking for a Deal? The Colony may be a place to check out.
It was up DOWN -14.9% to a median sales price of $430k
it is down -13% from the peak
Year to Date it is down -1.1%.
Days on Market is at 16 days and rising
The % of Original Price was 101.1% and rising
The Months Supply rose to 1.9 months and rising up from June 1.5 months
homes for sale rose to 90, up from June reading of 80.
Dallas Housing Market Overall Performance July 2023
So that is how the cities at the two extremes did in July.
You may have noticed many cities that had very strong or weak months, often swing the other direction the following month, and that was evident in several cities that made the list.

July also marks the beginning of the Fall/Winter retracing. Typically the Dallas metro will now begin to either stay flat or will decline a bit through January of the next year. Even with interest rates and inflation, these trends appear to be continuing as we did have our market increases this year from February to June as we noted last month.
Looking at January to June from 2013 to 2020 we see that the spring and summer price appreciation run about 10-21% over that time, in 2023 it was softer than any of those previous periods as we were only up 8.5% during that same time frame.
As you also notice we will now decline anywhere from -6% to possibly squeaking out a small gain. On average we will see about a 2.4% decline until the spring market begins next year.
Since we only covered 20 cities in the winners and losers, here are the counties and how they did last month and how they are down year to date.

Denton County

Collin County

Dallas County

Tarrant County

Rockwall County

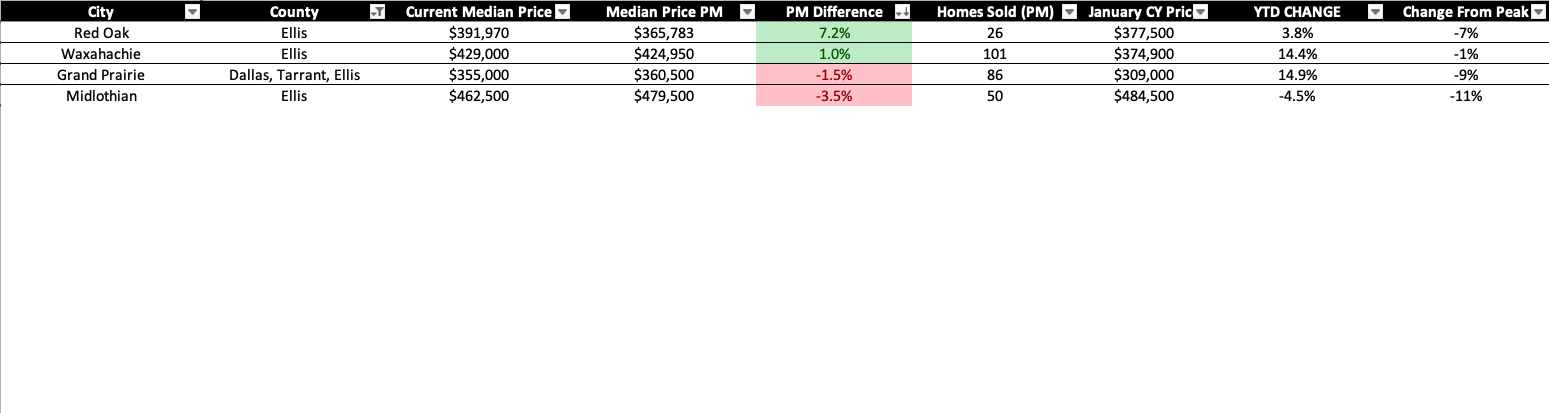
Ellis County
Alright, so how did the DFW metro do overall? Now that you have seen many of the pieces that make up the whole pie what is your Guess? did the market go up or down in July?
DFW in July managed to pull off a slight gain from June up to a median sales price of $392,475. Which was up 0.38% gain. Which actually as you can see from the wider chart going back 10 years, and the cycles I spoke about was actually pretty good. So as you can see from the chart, we will likely soften a bit the remainder of the year if things are typical in terms of cycles, but we know nothing is normal in the past 3 yrs.

Looking at supply and demand metrics.
Days on Market ticked up to 19 days, up from 18 the previous month.

The months supply is also rising, really since the market began to recover in February, and is now at 3.1 months.
This tends to be more of a lagging indicator, as it will typically top for the year around August-September as you can see on the longer range chart.
And going right along with this metric are the Homes for Sale, which is part of the Months Supply, but in raw numbers. That was up to 26,317 for July also rising since February.

In terms of demand, the PCT of Original Price was at 98.3%, which is down slightly from June. This is also another metric that will follow the cycles in the markets as you can see from the chart. As the market softens, those her are selling in the fall/winter cycle, are typically people who HAVE TO sell, and will likely be more open to additional terms and conditions, thus the % will drop, and as the market is heating up, demand increases and so does the %.

So that is the recap for July, I hope it was something you enjoy and find it valuable. Make sure to keep checking back as we are releasing videos all about living in Dallas Texas, so if your relocating to Texas, make sure to reach out, we help people just like you all the time. It has been awesome getting to know so many people moving here to Dallas and being part of their journey. Also if you looking to sell your home, we can help with that too.
So until the next time, take care